CoastalCorporation COASTCORP full analysis,charts,indicators,moving averages,SMA,DMA,EMA,ADX,MACD,RSICoastal Corporation COASTCORP WideScreen charts, DMA,SMA,EMA technical analysis, forecast prediction, by indicators ADX,MACD,RSI,CCI NSE stock exchange
Daily price and charts and targets CoastalCorporation Strong Daily Stock price targets for CoastalCorporation COASTCORP are 40.5 and 45.44 | Daily Target 1 | 36.96 | | Daily Target 2 | 39.09 | | Daily Target 3 | 41.896666666667 | | Daily Target 4 | 44.03 | | Daily Target 5 | 46.84 |
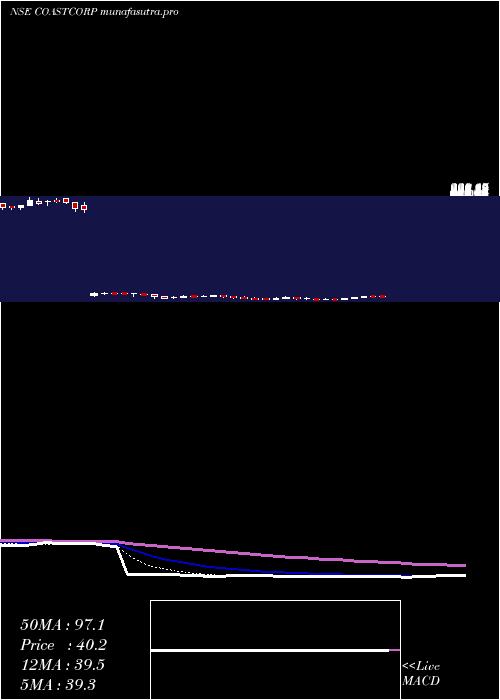
Daily price and volume Coastal Corporation
| Date |
Closing |
Open |
Range |
Volume |
Tue 28 October 2025 |
41.23 (3.07%) |
40.55 |
39.76 - 44.70 |
0.6285 times |
Mon 27 October 2025 |
40.00 (-6.63%) |
42.40 |
39.66 - 42.62 |
0.3895 times |
Fri 24 October 2025 |
42.84 (-4.37%) |
47.50 |
42.10 - 48.37 |
3.6462 times |
Thu 23 October 2025 |
44.80 (19.98%) |
43.00 |
42.25 - 44.80 |
4.644 times |
Tue 21 October 2025 |
37.34 (0.24%) |
37.25 |
37.20 - 38.90 |
0.0273 times |
Mon 20 October 2025 |
37.25 (-0.69%) |
37.60 |
36.98 - 37.75 |
0.0612 times |
Fri 17 October 2025 |
37.51 (1.21%) |
37.30 |
36.93 - 38.80 |
0.1987 times |
Thu 16 October 2025 |
37.06 (2.23%) |
36.55 |
36.55 - 37.40 |
0.0717 times |
Wed 15 October 2025 |
36.25 (-0.03%) |
35.85 |
35.85 - 38.95 |
0.2101 times |
Tue 14 October 2025 |
36.26 (-1.84%) |
37.30 |
35.80 - 37.30 |
0.1229 times |
Mon 13 October 2025 |
36.94 (-2.38%) |
38.00 |
36.25 - 38.83 |
0.1005 times |
Weekly price and charts CoastalCorporation Strong weekly Stock price targets for CoastalCorporation COASTCORP are 37.93 and 42.97 | Weekly Target 1 | 36.82 | | Weekly Target 2 | 39.03 | | Weekly Target 3 | 41.863333333333 | | Weekly Target 4 | 44.07 | | Weekly Target 5 | 46.9 |
Weekly price and volumes for Coastal Corporation
| Date |
Closing |
Open |
Range |
Volume |
Tue 28 October 2025 |
41.23 (-3.76%) |
42.40 |
39.66 - 44.70 |
0.6185 times |
Fri 24 October 2025 |
42.84 (14.21%) |
37.60 |
36.98 - 48.37 |
5.0903 times |
Fri 17 October 2025 |
37.51 (-0.87%) |
38.00 |
35.80 - 38.95 |
0.4277 times |
Fri 10 October 2025 |
37.84 (9.33%) |
34.60 |
34.25 - 38.24 |
0.3479 times |
Fri 03 October 2025 |
34.61 (5.04%) |
33.38 |
32.73 - 36.00 |
0.2284 times |
Fri 26 September 2025 |
32.95 (-13.2%) |
37.51 |
32.50 - 38.69 |
0.5368 times |
Fri 19 September 2025 |
37.96 (-1.5%) |
39.30 |
36.59 - 39.99 |
0.6235 times |
Fri 12 September 2025 |
38.54 (21.62%) |
31.50 |
30.95 - 41.68 |
1.5906 times |
Fri 05 September 2025 |
31.69 (0.54%) |
31.51 |
30.01 - 32.25 |
0.3059 times |
Fri 29 August 2025 |
31.52 (-5.57%) |
33.80 |
31.20 - 34.08 |
0.2304 times |
Fri 22 August 2025 |
33.38 (1.83%) |
32.55 |
32.55 - 37.88 |
0.5188 times |

Monthly price and charts CoastalCorporation Strong monthly Stock price targets for CoastalCorporation COASTCORP are 37.74 and 51.86 | Monthly Target 1 | 27.16 | | Monthly Target 2 | 34.2 | | Monthly Target 3 | 41.283333333333 | | Monthly Target 4 | 48.32 | | Monthly Target 5 | 55.4 |
Monthly price and volumes Coastal Corporation
| Date |
Closing |
Open |
Range |
Volume |
Tue 28 October 2025 |
41.23 (16.96%) |
35.40 |
34.25 - 48.37 |
3.2942 times |
Tue 30 September 2025 |
35.25 (11.83%) |
31.51 |
30.01 - 41.68 |
1.604 times |
Fri 29 August 2025 |
31.52 (-10.78%) |
35.35 |
31.20 - 37.88 |
0.5337 times |
Thu 31 July 2025 |
35.33 (-7.8%) |
38.70 |
34.95 - 39.15 |
0.61 times |
Mon 30 June 2025 |
38.32 (-3.16%) |
39.00 |
37.05 - 43.68 |
0.6639 times |
Fri 30 May 2025 |
39.57 (6.97%) |
36.65 |
32.70 - 43.15 |
0.8543 times |
Wed 30 April 2025 |
36.99 (4.37%) |
35.44 |
33.61 - 41.91 |
0.6843 times |
Fri 28 March 2025 |
35.44 (-83.04%) |
215.90 |
34.74 - 221.00 |
1.4714 times |
Fri 28 February 2025 |
208.97 (-12.42%) |
243.80 |
202.99 - 246.90 |
0.1056 times |
Fri 31 January 2025 |
238.60 (-10.07%) |
265.90 |
223.90 - 275.00 |
0.1787 times |
Tue 31 December 2024 |
265.31 (10.61%) |
242.15 |
235.99 - 276.67 |
0.4016 times |

DMA SMA EMA moving averages of Coastal Corporation COASTCORP
DMA (daily moving average) of Coastal Corporation COASTCORP
| DMA period | DMA value | | 5 day DMA | 41.24 | | 12 day DMA | 38.78 | | 20 day DMA | 37.42 | | 35 day DMA | 36.72 | | 50 day DMA | 35.47 | | 100 day DMA | 36.39 | | 150 day DMA | 36.99 | | 200 day DMA | 75.04 | EMA (exponential moving average) of Coastal Corporation COASTCORP
| EMA period | EMA current | EMA prev | EMA prev2 | | 5 day EMA | 40.74 | 40.49 | 40.74 | | 12 day EMA | 39.23 | 38.87 | 38.67 | | 20 day EMA | 38.15 | 37.83 | 37.6 | | 35 day EMA | 36.84 | 36.58 | 36.38 | | 50 day EMA | 35.87 | 35.65 | 35.47 |
SMA (simple moving average) of Coastal Corporation COASTCORP
| SMA period | SMA current | SMA prev | SMA prev2 | | 5 day SMA | 41.24 | 40.45 | 39.95 | | 12 day SMA | 38.78 | 38.4 | 38.06 | | 20 day SMA | 37.42 | 37 | 36.66 | | 35 day SMA | 36.72 | 36.45 | 36.21 | | 50 day SMA | 35.47 | 35.31 | 35.15 | | 100 day SMA | 36.39 | 36.37 | 36.35 | | 150 day SMA | 36.99 | 36.98 | 36.98 | | 200 day SMA | 75.04 | 76.09 | 77.24 |
|
|
