CropLife CLSL_SM full analysis,charts,indicators,moving averages,SMA,DMA,EMA,ADX,MACD,RSICrop Life CLSL_SM WideScreen charts, DMA,SMA,EMA technical analysis, forecast prediction, by indicators ADX,MACD,RSI,CCI NSE stock exchange
Daily price and charts and targets CropLife Strong Daily Stock price targets for CropLife CLSL_SM are 54.5 and 55.5 | Daily Target 1 | 54.33 | | Daily Target 2 | 54.67 | | Daily Target 3 | 55.333333333333 | | Daily Target 4 | 55.67 | | Daily Target 5 | 56.33 |
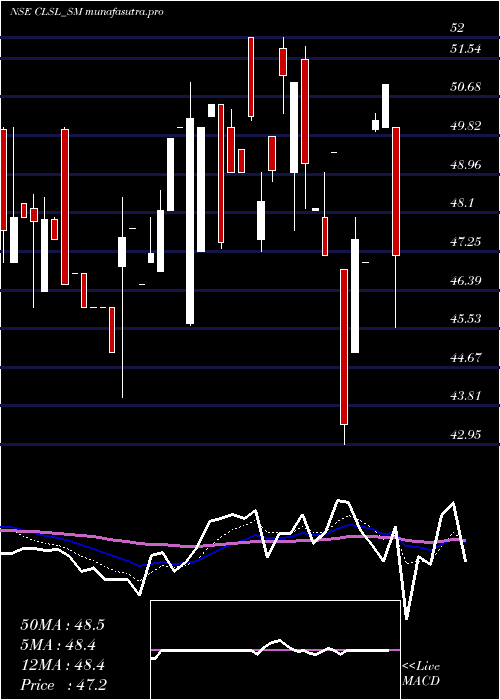
Daily price and volume Crop Life
| Date |
Closing |
Open |
Range |
Volume |
Tue 28 October 2025 |
55.00 (0%) |
55.00 |
55.00 - 56.00 |
3.75 times |
Mon 27 October 2025 |
55.00 (-0.09%) |
55.80 |
55.00 - 55.80 |
1.1538 times |
Fri 24 October 2025 |
55.05 (-0.63%) |
55.05 |
55.05 - 55.05 |
0.0962 times |
Thu 23 October 2025 |
55.40 (0.64%) |
56.75 |
55.25 - 57.90 |
0.3846 times |
Tue 21 October 2025 |
55.05 (0.09%) |
55.00 |
55.00 - 55.10 |
0.5769 times |
Mon 20 October 2025 |
55.00 (-1.79%) |
56.00 |
55.00 - 56.00 |
0.6731 times |
Fri 17 October 2025 |
56.00 (1.82%) |
55.10 |
54.90 - 56.95 |
2.1154 times |
Thu 16 October 2025 |
55.00 (-1.08%) |
55.05 |
55.00 - 57.00 |
0.7692 times |
Wed 15 October 2025 |
55.60 (1.28%) |
55.10 |
55.10 - 55.60 |
0.1923 times |
Mon 13 October 2025 |
54.90 (-0.18%) |
54.85 |
54.85 - 54.90 |
0.2885 times |
Fri 10 October 2025 |
55.00 (-0.18%) |
55.60 |
55.00 - 55.60 |
0.4808 times |
Weekly price and charts CropLife Strong weekly Stock price targets for CropLife CLSL_SM are 54.5 and 55.5 | Weekly Target 1 | 54.33 | | Weekly Target 2 | 54.67 | | Weekly Target 3 | 55.333333333333 | | Weekly Target 4 | 55.67 | | Weekly Target 5 | 56.33 |
Weekly price and volumes for Crop Life
| Date |
Closing |
Open |
Range |
Volume |
Tue 28 October 2025 |
55.00 (-0.09%) |
55.80 |
55.00 - 56.00 |
1.7466 times |
Fri 24 October 2025 |
55.05 (-1.7%) |
56.00 |
55.00 - 57.90 |
0.6164 times |
Fri 17 October 2025 |
56.00 (1.82%) |
54.85 |
54.85 - 57.00 |
1.1986 times |
Fri 10 October 2025 |
55.00 (-1.26%) |
55.25 |
54.90 - 57.00 |
0.7534 times |
Fri 03 October 2025 |
55.70 (-0.89%) |
56.00 |
55.00 - 56.05 |
1.0616 times |
Fri 26 September 2025 |
56.20 (-7.11%) |
57.05 |
56.00 - 57.05 |
0.2397 times |
Fri 19 September 2025 |
60.50 (0.92%) |
58.75 |
57.00 - 60.50 |
1.5068 times |
Fri 12 September 2025 |
59.95 (6.67%) |
56.30 |
56.30 - 62.80 |
1.4384 times |
Fri 05 September 2025 |
56.20 (-3.1%) |
57.45 |
56.00 - 58.00 |
1.1301 times |
Tue 26 August 2025 |
58.00 (-3.33%) |
60.00 |
56.00 - 60.00 |
0.3082 times |
Fri 22 August 2025 |
60.00 (-2.28%) |
59.70 |
58.45 - 60.00 |
0.4452 times |

Monthly price and charts CropLife Strong monthly Stock price targets for CropLife CLSL_SM are 53.4 and 56.45 | Monthly Target 1 | 52.87 | | Monthly Target 2 | 53.93 | | Monthly Target 3 | 55.916666666667 | | Monthly Target 4 | 56.98 | | Monthly Target 5 | 58.97 |
Monthly price and volumes Crop Life
| Date |
Closing |
Open |
Range |
Volume |
Tue 28 October 2025 |
55.00 (0%) |
55.40 |
54.85 - 57.90 |
0.7941 times |
Tue 30 September 2025 |
55.00 (-5.17%) |
57.45 |
55.00 - 62.80 |
0.8111 times |
Tue 26 August 2025 |
58.00 (1.75%) |
57.00 |
53.20 - 62.10 |
0.7657 times |
Thu 31 July 2025 |
57.00 (12.76%) |
52.90 |
50.05 - 58.95 |
1.4577 times |
Mon 30 June 2025 |
50.55 (3.59%) |
49.50 |
47.15 - 53.00 |
1.0777 times |
Fri 30 May 2025 |
48.80 (-0.41%) |
49.00 |
46.25 - 51.45 |
0.8452 times |
Wed 30 April 2025 |
49.00 (-3.92%) |
51.50 |
42.95 - 51.80 |
0.987 times |
Fri 28 March 2025 |
51.00 (7.26%) |
47.75 |
45.60 - 52.00 |
1.2195 times |
Fri 28 February 2025 |
47.55 (-2.76%) |
48.50 |
44.00 - 52.95 |
0.8452 times |
Fri 31 January 2025 |
48.90 (-2.49%) |
50.15 |
45.65 - 52.50 |
1.1968 times |
Tue 31 December 2024 |
50.15 (11.44%) |
45.50 |
45.00 - 53.95 |
1.2025 times |

DMA SMA EMA moving averages of Crop Life CLSL_SM
DMA (daily moving average) of Crop Life CLSL_SM
| DMA period | DMA value | | 5 day DMA | 55.1 | | 12 day DMA | 55.18 | | 20 day DMA | 55.33 | | 35 day DMA | 56.81 | | 50 day DMA | 57.4 | | 100 day DMA | 54.73 | | 150 day DMA | 52.71 | | 200 day DMA | 51.8 | EMA (exponential moving average) of Crop Life CLSL_SM
| EMA period | EMA current | EMA prev | EMA prev2 | | 5 day EMA | 55.09 | 55.13 | 55.2 | | 12 day EMA | 55.33 | 55.39 | 55.46 | | 20 day EMA | 55.76 | 55.84 | 55.93 | | 35 day EMA | 56.32 | 56.4 | 56.48 | | 50 day EMA | 57.16 | 57.25 | 57.34 |
SMA (simple moving average) of Crop Life CLSL_SM
| SMA period | SMA current | SMA prev | SMA prev2 | | 5 day SMA | 55.1 | 55.1 | 55.3 | | 12 day SMA | 55.18 | 55.18 | 55.18 | | 20 day SMA | 55.33 | 55.61 | 55.86 | | 35 day SMA | 56.81 | 56.88 | 57.02 | | 50 day SMA | 57.4 | 57.44 | 57.48 | | 100 day SMA | 54.73 | 54.68 | 54.63 | | 150 day SMA | 52.71 | 52.65 | 52.59 | | 200 day SMA | 51.8 | 51.77 | 51.73 |
|
|
