ChamanLal CLSEL full analysis,charts,indicators,moving averages,SMA,DMA,EMA,ADX,MACD,RSIChaman Lal CLSEL WideScreen charts, DMA,SMA,EMA technical analysis, forecast prediction, by indicators ADX,MACD,RSI,CCI NSE stock exchange
Daily price and charts and targets ChamanLal Strong Daily Stock price targets for ChamanLal CLSEL are 277.23 and 286.53 | Daily Target 1 | 275.45 | | Daily Target 2 | 279 | | Daily Target 3 | 284.75 | | Daily Target 4 | 288.3 | | Daily Target 5 | 294.05 |
Daily price and volume Chaman Lal
| Date |
Closing |
Open |
Range |
Volume |
Tue 28 October 2025 |
282.55 (-2.2%) |
286.00 |
281.20 - 290.50 |
0.5628 times |
Mon 27 October 2025 |
288.90 (-0.76%) |
293.30 |
285.15 - 294.80 |
0.8021 times |
Fri 24 October 2025 |
291.10 (3.21%) |
281.95 |
278.50 - 294.00 |
3.1571 times |
Thu 23 October 2025 |
282.05 (7.35%) |
269.00 |
261.00 - 284.50 |
2.5573 times |
Tue 21 October 2025 |
262.75 (1.14%) |
260.40 |
259.85 - 264.95 |
0.1719 times |
Mon 20 October 2025 |
259.80 (-1.85%) |
264.70 |
257.10 - 264.70 |
0.2794 times |
Fri 17 October 2025 |
264.70 (4.65%) |
252.95 |
252.40 - 267.90 |
1.1943 times |
Thu 16 October 2025 |
252.95 (-1.79%) |
256.35 |
252.15 - 258.75 |
0.4967 times |
Wed 15 October 2025 |
257.55 (0.92%) |
256.50 |
253.30 - 260.00 |
0.3758 times |
Tue 14 October 2025 |
255.20 (-2.47%) |
261.55 |
253.00 - 263.50 |
0.4027 times |
Mon 13 October 2025 |
261.65 (2.23%) |
258.00 |
258.00 - 264.30 |
0.4039 times |
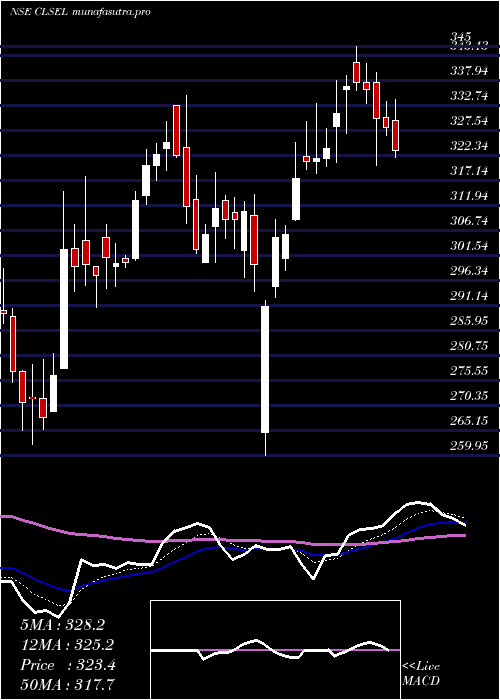
Weekly price and charts ChamanLal Strong weekly Stock price targets for ChamanLal CLSEL are 275.08 and 288.68 | Weekly Target 1 | 272.58 | | Weekly Target 2 | 277.57 | | Weekly Target 3 | 286.18333333333 | | Weekly Target 4 | 291.17 | | Weekly Target 5 | 299.78 |
Weekly price and volumes for Chaman Lal
| Date |
Closing |
Open |
Range |
Volume |
Tue 28 October 2025 |
282.55 (-2.94%) |
293.30 |
281.20 - 294.80 |
0.5157 times |
Fri 24 October 2025 |
291.10 (9.97%) |
264.70 |
257.10 - 294.00 |
2.3297 times |
Fri 17 October 2025 |
264.70 (3.42%) |
258.00 |
252.15 - 267.90 |
1.0857 times |
Fri 10 October 2025 |
255.95 (-1.1%) |
258.80 |
252.10 - 269.95 |
1.0626 times |
Fri 03 October 2025 |
258.80 (-2.82%) |
263.60 |
257.55 - 266.00 |
0.5093 times |
Fri 26 September 2025 |
266.30 (-6.64%) |
287.25 |
265.00 - 287.25 |
0.9303 times |
Fri 19 September 2025 |
285.25 (1.89%) |
280.95 |
277.00 - 292.00 |
2.3128 times |
Fri 12 September 2025 |
279.95 (-2.95%) |
285.80 |
278.00 - 290.00 |
0.5698 times |
Fri 05 September 2025 |
288.45 (3.15%) |
279.65 |
278.90 - 291.95 |
0.3631 times |
Fri 29 August 2025 |
279.65 (-0.53%) |
282.60 |
277.05 - 286.05 |
0.3209 times |
Fri 22 August 2025 |
281.15 (-2.88%) |
294.95 |
277.00 - 298.00 |
0.9877 times |
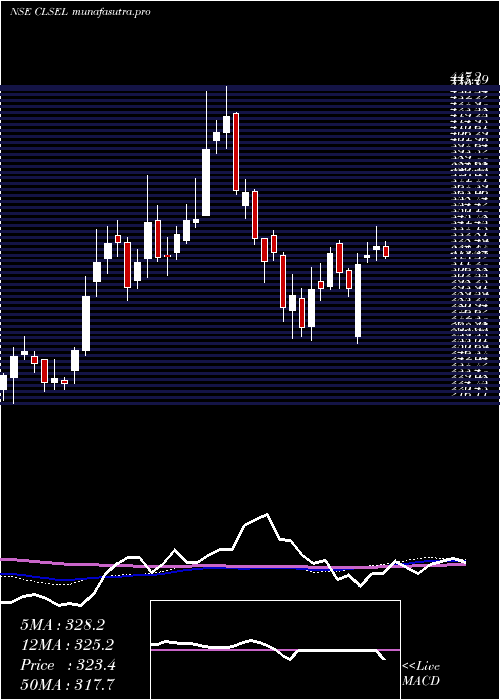
Monthly price and charts ChamanLal Strong monthly Stock price targets for ChamanLal CLSEL are 267.33 and 310.03 | Monthly Target 1 | 233.78 | | Monthly Target 2 | 258.17 | | Monthly Target 3 | 276.48333333333 | | Monthly Target 4 | 300.87 | | Monthly Target 5 | 319.18 |
Monthly price and volumes Chaman Lal
| Date |
Closing |
Open |
Range |
Volume |
Tue 28 October 2025 |
282.55 (7.76%) |
261.00 |
252.10 - 294.80 |
1.0089 times |
Tue 30 September 2025 |
262.20 (-6.24%) |
279.65 |
260.05 - 292.00 |
0.8397 times |
Fri 29 August 2025 |
279.65 (-12.4%) |
317.00 |
277.00 - 323.30 |
0.5929 times |
Thu 31 July 2025 |
319.25 (-16.38%) |
384.05 |
311.00 - 395.75 |
1.7952 times |
Mon 30 June 2025 |
381.80 (10.88%) |
344.45 |
319.10 - 383.90 |
1.6033 times |
Fri 30 May 2025 |
344.35 (10.6%) |
311.35 |
295.80 - 378.80 |
1.042 times |
Wed 30 April 2025 |
311.35 (0%) |
313.00 |
259.95 - 345.00 |
0.5555 times |
Fri 28 March 2025 |
311.35 (14.89%) |
272.00 |
262.20 - 334.90 |
0.7434 times |
Fri 28 February 2025 |
271.00 (-15.25%) |
338.20 |
263.00 - 341.95 |
0.6937 times |
Fri 31 January 2025 |
319.75 (-25.35%) |
434.80 |
303.80 - 447.20 |
1.1253 times |
Tue 31 December 2024 |
428.35 (26.43%) |
334.75 |
332.55 - 443.40 |
3.1391 times |

DMA SMA EMA moving averages of Chaman Lal CLSEL
DMA (daily moving average) of Chaman Lal CLSEL
| DMA period | DMA value | | 5 day DMA | 281.47 | | 12 day DMA | 267.93 | | 20 day DMA | 263.74 | | 35 day DMA | 271.25 | | 50 day DMA | 275.29 | | 100 day DMA | 306.05 | | 150 day DMA | 312.85 | | 200 day DMA | 314.65 | EMA (exponential moving average) of Chaman Lal CLSEL
| EMA period | EMA current | EMA prev | EMA prev2 | | 5 day EMA | 280.78 | 279.9 | 275.4 | | 12 day EMA | 272.82 | 271.05 | 267.81 | | 20 day EMA | 270.63 | 269.38 | 267.33 | | 35 day EMA | 272.25 | 271.64 | 270.62 | | 50 day EMA | 277.33 | 277.12 | 276.64 |
SMA (simple moving average) of Chaman Lal CLSEL
| SMA period | SMA current | SMA prev | SMA prev2 | | 5 day SMA | 281.47 | 276.92 | 272.08 | | 12 day SMA | 267.93 | 265.5 | 262.61 | | 20 day SMA | 263.74 | 262.93 | 262.15 | | 35 day SMA | 271.25 | 271.42 | 271.33 | | 50 day SMA | 275.29 | 275.51 | 275.51 | | 100 day SMA | 306.05 | 306.7 | 307.13 | | 150 day SMA | 312.85 | 313.1 | 313.27 | | 200 day SMA | 314.65 | 315.22 | 315.9 |
|
|
