CleanScience CLEAN full analysis,charts,indicators,moving averages,SMA,DMA,EMA,ADX,MACD,RSIClean Science CLEAN WideScreen charts, DMA,SMA,EMA technical analysis, forecast prediction, by indicators ADX,MACD,RSI,CCI NSE stock exchange
Daily price and charts and targets CleanScience Strong Daily Stock price targets for CleanScience CLEAN are 1040.1 and 1051 | Daily Target 1 | 1037.1 | | Daily Target 2 | 1043.1 | | Daily Target 3 | 1048 | | Daily Target 4 | 1054 | | Daily Target 5 | 1058.9 |
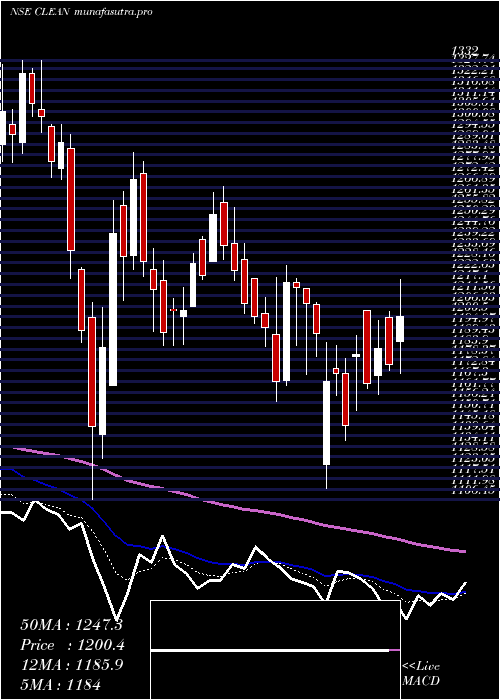
Daily price and volume Clean Science
| Date |
Closing |
Open |
Range |
Volume |
Tue 28 October 2025 |
1049.10 (0.42%) |
1050.00 |
1042.00 - 1052.90 |
0.7404 times |
Mon 27 October 2025 |
1044.70 (-1.62%) |
1061.90 |
1043.00 - 1063.30 |
0.9762 times |
Fri 24 October 2025 |
1061.90 (0.02%) |
1061.90 |
1052.20 - 1069.80 |
0.6454 times |
Thu 23 October 2025 |
1061.70 (0.82%) |
1057.30 |
1049.00 - 1065.00 |
1.8104 times |
Tue 21 October 2025 |
1053.10 (1.67%) |
1047.50 |
1041.20 - 1057.00 |
0.3822 times |
Mon 20 October 2025 |
1035.80 (-1.47%) |
1060.00 |
1033.00 - 1060.90 |
1.2267 times |
Fri 17 October 2025 |
1051.30 (-0.28%) |
1050.00 |
1041.40 - 1061.10 |
0.8227 times |
Thu 16 October 2025 |
1054.20 (1.23%) |
1041.90 |
1041.90 - 1066.10 |
1.1835 times |
Wed 15 October 2025 |
1041.40 (-0.48%) |
1046.00 |
1039.00 - 1053.10 |
0.9016 times |
Tue 14 October 2025 |
1046.40 (-1.78%) |
1065.40 |
1039.70 - 1066.50 |
1.311 times |
Mon 13 October 2025 |
1065.40 (-0.64%) |
1072.00 |
1060.10 - 1097.20 |
2.5535 times |
Weekly price and charts CleanScience Strong weekly Stock price targets for CleanScience CLEAN are 1034.9 and 1056.2 | Weekly Target 1 | 1030.17 | | Weekly Target 2 | 1039.63 | | Weekly Target 3 | 1051.4666666667 | | Weekly Target 4 | 1060.93 | | Weekly Target 5 | 1072.77 |
Weekly price and volumes for Clean Science
| Date |
Closing |
Open |
Range |
Volume |
Tue 28 October 2025 |
1049.10 (-1.21%) |
1061.90 |
1042.00 - 1063.30 |
0.1463 times |
Fri 24 October 2025 |
1061.90 (1.01%) |
1060.00 |
1033.00 - 1069.80 |
0.3464 times |
Fri 17 October 2025 |
1051.30 (-1.96%) |
1072.00 |
1039.00 - 1097.20 |
0.5771 times |
Fri 10 October 2025 |
1072.30 (-1.19%) |
1090.80 |
1033.00 - 1097.90 |
1.1211 times |
Fri 03 October 2025 |
1085.20 (-1.44%) |
1105.00 |
1077.00 - 1118.00 |
0.4673 times |
Fri 26 September 2025 |
1101.10 (-6.53%) |
1170.00 |
1092.90 - 1173.50 |
1.3987 times |
Fri 19 September 2025 |
1178.00 (1.25%) |
1161.00 |
1144.00 - 1212.00 |
0.704 times |
Fri 12 September 2025 |
1163.50 (-2.16%) |
1189.00 |
1152.00 - 1199.00 |
0.7818 times |
Fri 05 September 2025 |
1189.20 (1.25%) |
1178.00 |
1151.70 - 1217.90 |
2.1312 times |
Fri 29 August 2025 |
1174.50 (1.79%) |
1160.50 |
1131.10 - 1188.00 |
2.326 times |
Fri 22 August 2025 |
1153.80 (-2.29%) |
1184.90 |
1070.50 - 1256.80 |
19.7619 times |

Monthly price and charts CleanScience Strong monthly Stock price targets for CleanScience CLEAN are 1003.55 and 1078.55 | Monthly Target 1 | 988.37 | | Monthly Target 2 | 1018.73 | | Monthly Target 3 | 1063.3666666667 | | Monthly Target 4 | 1093.73 | | Monthly Target 5 | 1138.37 |
Monthly price and volumes Clean Science
| Date |
Closing |
Open |
Range |
Volume |
Tue 28 October 2025 |
1049.10 (-4.51%) |
1094.60 |
1033.00 - 1108.00 |
0.5748 times |
Tue 30 September 2025 |
1098.60 (-6.46%) |
1178.00 |
1077.00 - 1217.90 |
1.2779 times |
Fri 29 August 2025 |
1174.50 (-3.91%) |
1223.00 |
1070.50 - 1256.80 |
5.4683 times |
Thu 31 July 2025 |
1222.30 (-16.6%) |
1470.00 |
1220.00 - 1497.00 |
0.4025 times |
Mon 30 June 2025 |
1465.60 (-5.4%) |
1555.00 |
1392.00 - 1566.00 |
0.2692 times |
Fri 30 May 2025 |
1549.20 (31.87%) |
1177.00 |
1148.10 - 1600.00 |
0.5989 times |
Wed 30 April 2025 |
1174.80 (0.64%) |
1168.00 |
1112.15 - 1250.20 |
0.4196 times |
Fri 28 March 2025 |
1167.35 (-2.17%) |
1200.05 |
1106.45 - 1284.90 |
0.2477 times |
Fri 28 February 2025 |
1193.25 (-16.93%) |
1441.10 |
1187.10 - 1500.45 |
0.2128 times |
Fri 31 January 2025 |
1436.45 (0.94%) |
1408.10 |
1300.00 - 1558.95 |
0.5285 times |
Tue 31 December 2024 |
1423.10 (10.82%) |
1294.00 |
1273.85 - 1507.00 |
0.6956 times |

DMA SMA EMA moving averages of Clean Science CLEAN
DMA (daily moving average) of Clean Science CLEAN
| DMA period | DMA value | | 5 day DMA | 1054.1 | | 12 day DMA | 1053.11 | | 20 day DMA | 1062.03 | | 35 day DMA | 1102.82 | | 50 day DMA | 1122.48 | | 100 day DMA | 1249.04 | | 150 day DMA | 1251.78 | | 200 day DMA | 1272.93 | EMA (exponential moving average) of Clean Science CLEAN
| EMA period | EMA current | EMA prev | EMA prev2 | | 5 day EMA | 1051.25 | 1052.32 | 1056.13 | | 12 day EMA | 1056.7 | 1058.08 | 1060.51 | | 20 day EMA | 1069.01 | 1071.11 | 1073.89 | | 35 day EMA | 1092.48 | 1095.03 | 1097.99 | | 50 day EMA | 1120.98 | 1123.91 | 1127.14 |
SMA (simple moving average) of Clean Science CLEAN
| SMA period | SMA current | SMA prev | SMA prev2 | | 5 day SMA | 1054.1 | 1051.44 | 1052.76 | | 12 day SMA | 1053.11 | 1052.15 | 1052.69 | | 20 day SMA | 1062.03 | 1064.63 | 1068.37 | | 35 day SMA | 1102.82 | 1106.82 | 1109.99 | | 50 day SMA | 1122.48 | 1126.1 | 1128.4 | | 100 day SMA | 1249.04 | 1253.44 | 1257.79 | | 150 day SMA | 1251.78 | 1252.93 | 1254.15 | | 200 day SMA | 1272.93 | 1274.91 | 1277.16 |
|
|
