CieAutomotive CIEINDIA full analysis,charts,indicators,moving averages,SMA,DMA,EMA,ADX,MACD,RSICie Automotive CIEINDIA WideScreen charts, DMA,SMA,EMA technical analysis, forecast prediction, by indicators ADX,MACD,RSI,CCI NSE stock exchange
Daily price and charts and targets CieAutomotive Strong Daily Stock price targets for CieAutomotive CIEINDIA are 437.98 and 446.08 | Daily Target 1 | 432.08 | | Daily Target 2 | 435.77 | | Daily Target 3 | 440.18333333333 | | Daily Target 4 | 443.87 | | Daily Target 5 | 448.28 |
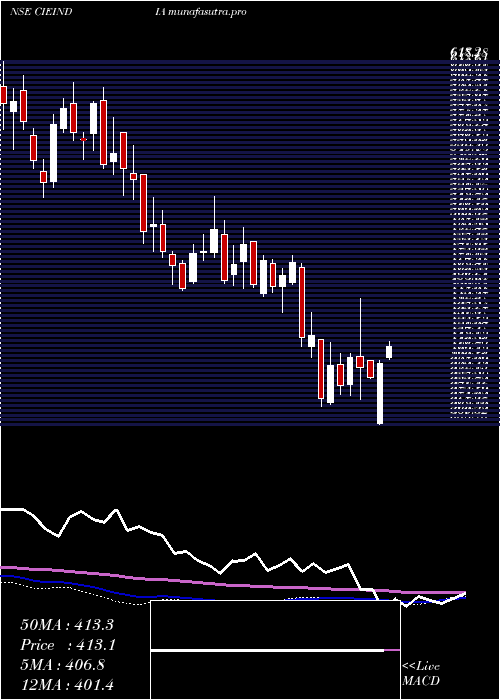
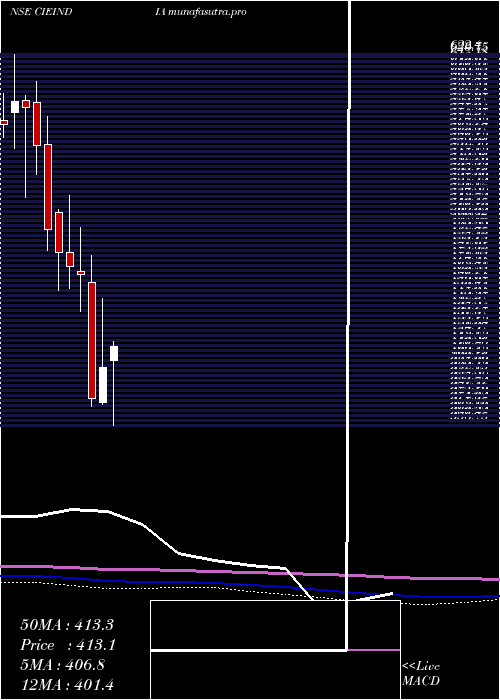
Daily price and volume Cie Automotive
| Date |
Closing |
Open |
Range |
Volume |
Wed 29 October 2025 |
439.45 (0.18%) |
438.65 |
436.50 - 444.60 |
0.3868 times |
Tue 28 October 2025 |
438.65 (1.2%) |
432.90 |
432.85 - 440.00 |
0.1941 times |
Mon 27 October 2025 |
433.45 (2.05%) |
428.20 |
428.20 - 445.00 |
0.7539 times |
Fri 24 October 2025 |
424.75 (-1.58%) |
431.55 |
424.00 - 432.50 |
0.1459 times |
Thu 23 October 2025 |
431.55 (-0.39%) |
435.40 |
430.30 - 437.50 |
0.1912 times |
Tue 21 October 2025 |
433.25 (-0.61%) |
436.00 |
431.35 - 439.00 |
0.0713 times |
Mon 20 October 2025 |
435.90 (0.93%) |
432.50 |
428.70 - 440.95 |
0.4362 times |
Fri 17 October 2025 |
431.90 (1.36%) |
432.10 |
427.10 - 458.00 |
7.1603 times |
Thu 16 October 2025 |
426.10 (2.42%) |
418.00 |
416.10 - 428.80 |
0.3334 times |
Wed 15 October 2025 |
416.05 (0.97%) |
412.05 |
408.30 - 422.60 |
0.3269 times |
Tue 14 October 2025 |
412.05 (-1.2%) |
419.20 |
411.10 - 419.25 |
0.1863 times |

Weekly price and charts CieAutomotive Strong weekly Stock price targets for CieAutomotive CIEINDIA are 433.83 and 450.63 | Weekly Target 1 | 420.75 | | Weekly Target 2 | 430.1 | | Weekly Target 3 | 437.55 | | Weekly Target 4 | 446.9 | | Weekly Target 5 | 454.35 |
Weekly price and volumes for Cie Automotive
| Date |
Closing |
Open |
Range |
Volume |
Wed 29 October 2025 |
439.45 (3.46%) |
428.20 |
428.20 - 445.00 |
0.5425 times |
Fri 24 October 2025 |
424.75 (-1.66%) |
432.50 |
424.00 - 440.95 |
0.3432 times |
Fri 17 October 2025 |
431.90 (2.12%) |
420.00 |
408.30 - 458.00 |
3.3336 times |
Fri 10 October 2025 |
422.95 (2.58%) |
408.45 |
405.50 - 432.00 |
1.0047 times |
Fri 03 October 2025 |
412.30 (-1.13%) |
422.40 |
397.25 - 422.90 |
0.5727 times |
Fri 26 September 2025 |
417.00 (-4.27%) |
435.60 |
415.80 - 448.50 |
1.3602 times |
Fri 19 September 2025 |
435.60 (7.46%) |
407.80 |
402.85 - 442.50 |
1.3885 times |
Fri 12 September 2025 |
405.35 (2.93%) |
394.50 |
394.50 - 410.80 |
0.5651 times |
Fri 05 September 2025 |
393.80 (2.38%) |
384.00 |
384.00 - 411.20 |
0.5828 times |
Fri 29 August 2025 |
384.65 (-3.49%) |
398.55 |
381.10 - 403.80 |
0.3068 times |
Fri 22 August 2025 |
398.55 (0.82%) |
397.40 |
395.10 - 414.20 |
0.3589 times |
Monthly price and charts CieAutomotive Strong monthly Stock price targets for CieAutomotive CIEINDIA are 421.15 and 476.3 | Monthly Target 1 | 378.28 | | Monthly Target 2 | 408.87 | | Monthly Target 3 | 433.43333333333 | | Monthly Target 4 | 464.02 | | Monthly Target 5 | 488.58 |
Monthly price and volumes Cie Automotive
| Date |
Closing |
Open |
Range |
Volume |
Wed 29 October 2025 |
439.45 (9.09%) |
402.85 |
402.85 - 458.00 |
1.6001 times |
Tue 30 September 2025 |
402.85 (4.73%) |
384.00 |
384.00 - 448.50 |
1.2261 times |
Fri 29 August 2025 |
384.65 (-4.35%) |
404.30 |
381.10 - 414.20 |
0.3516 times |
Thu 31 July 2025 |
402.15 (-9.24%) |
443.00 |
400.00 - 457.00 |
1.1517 times |
Mon 30 June 2025 |
443.10 (-1.48%) |
450.80 |
435.70 - 487.00 |
1.119 times |
Fri 30 May 2025 |
449.75 (10.79%) |
401.90 |
390.55 - 466.00 |
0.7666 times |
Wed 30 April 2025 |
405.95 (1.96%) |
403.30 |
356.75 - 430.00 |
0.7647 times |
Fri 28 March 2025 |
398.15 (5.88%) |
373.00 |
371.55 - 447.45 |
1.2509 times |
Fri 28 February 2025 |
376.05 (-19.03%) |
459.10 |
370.00 - 478.50 |
0.6669 times |
Fri 31 January 2025 |
464.45 (-1.34%) |
467.00 |
437.80 - 498.35 |
1.1023 times |
Tue 31 December 2024 |
470.75 (-1.99%) |
480.55 |
455.00 - 521.10 |
1.405 times |
DMA SMA EMA moving averages of Cie Automotive CIEINDIA
DMA (daily moving average) of Cie Automotive CIEINDIA
| DMA period | DMA value | | 5 day DMA | 433.57 | | 12 day DMA | 428.35 | | 20 day DMA | 422.41 | | 35 day DMA | 420.66 | | 50 day DMA | 413.31 | | 100 day DMA | 422.11 | | 150 day DMA | 421.48 | | 200 day DMA | 424.18 | EMA (exponential moving average) of Cie Automotive CIEINDIA
| EMA period | EMA current | EMA prev | EMA prev2 | | 5 day EMA | 435.1 | 432.92 | 430.06 | | 12 day EMA | 429.93 | 428.2 | 426.3 | | 20 day EMA | 425.96 | 424.54 | 423.05 | | 35 day EMA | 419.17 | 417.98 | 416.76 | | 50 day EMA | 413.96 | 412.92 | 411.87 |
SMA (simple moving average) of Cie Automotive CIEINDIA
| SMA period | SMA current | SMA prev | SMA prev2 | | 5 day SMA | 433.57 | 432.33 | 431.78 | | 12 day SMA | 428.35 | 426.97 | 425.05 | | 20 day SMA | 422.41 | 420.7 | 419.62 | | 35 day SMA | 420.66 | 419.68 | 418.4 | | 50 day SMA | 413.31 | 412.43 | 411.52 | | 100 day SMA | 422.11 | 422.22 | 422.29 | | 150 day SMA | 421.48 | 421.23 | 420.94 | | 200 day SMA | 424.18 | 424.33 | 424.5 |
|
|
