CheviotCompany CHEVIOT full analysis,charts,indicators,moving averages,SMA,DMA,EMA,ADX,MACD,RSICheviot Company CHEVIOT WideScreen charts, DMA,SMA,EMA technical analysis, forecast prediction, by indicators ADX,MACD,RSI,CCI NSE stock exchange
Daily price and charts and targets CheviotCompany Strong Daily Stock price targets for CheviotCompany CHEVIOT are 1151.3 and 1167.9 | Daily Target 1 | 1139.87 | | Daily Target 2 | 1146.13 | | Daily Target 3 | 1156.4666666667 | | Daily Target 4 | 1162.73 | | Daily Target 5 | 1173.07 |
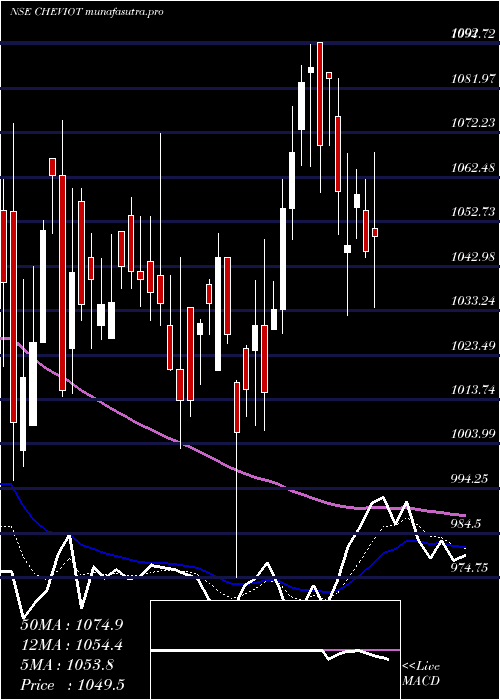
Daily price and volume Cheviot Company
| Date |
Closing |
Open |
Range |
Volume |
Tue 28 October 2025 |
1152.40 (-0.84%) |
1151.60 |
1150.20 - 1166.80 |
0.4485 times |
Mon 27 October 2025 |
1162.20 (1.1%) |
1154.60 |
1154.60 - 1170.90 |
1.1215 times |
Fri 24 October 2025 |
1149.60 (-0.26%) |
1152.60 |
1147.30 - 1156.80 |
0.49 times |
Thu 23 October 2025 |
1152.60 (-0.02%) |
1154.90 |
1144.10 - 1171.90 |
1.2215 times |
Tue 21 October 2025 |
1152.80 (2.08%) |
1121.10 |
1121.10 - 1164.00 |
1.2898 times |
Mon 20 October 2025 |
1129.30 (2.06%) |
1107.00 |
1084.10 - 1138.90 |
1.1504 times |
Fri 17 October 2025 |
1106.50 (-2.21%) |
1122.10 |
1100.00 - 1133.60 |
2.243 times |
Thu 16 October 2025 |
1131.50 (-0.6%) |
1144.30 |
1125.10 - 1144.30 |
0.6632 times |
Wed 15 October 2025 |
1138.30 (-0.19%) |
1144.80 |
1122.20 - 1144.80 |
0.885 times |
Tue 14 October 2025 |
1140.50 (-0.18%) |
1144.10 |
1140.10 - 1145.10 |
0.4872 times |
Mon 13 October 2025 |
1142.60 (-0.92%) |
1152.80 |
1141.50 - 1156.90 |
0.597 times |
Weekly price and charts CheviotCompany Strong weekly Stock price targets for CheviotCompany CHEVIOT are 1140.95 and 1161.65 | Weekly Target 1 | 1137.13 | | Weekly Target 2 | 1144.77 | | Weekly Target 3 | 1157.8333333333 | | Weekly Target 4 | 1165.47 | | Weekly Target 5 | 1178.53 |
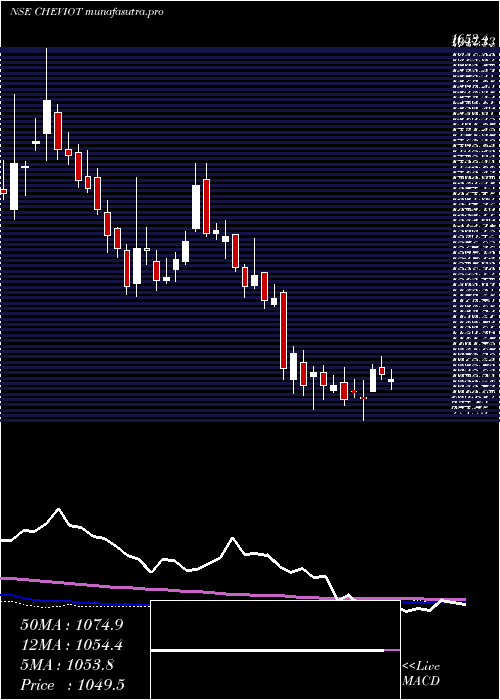
Weekly price and volumes for Cheviot Company
| Date |
Closing |
Open |
Range |
Volume |
Tue 28 October 2025 |
1152.40 (0.24%) |
1154.60 |
1150.20 - 1170.90 |
0.2597 times |
Fri 24 October 2025 |
1149.60 (3.9%) |
1107.00 |
1084.10 - 1171.90 |
0.6869 times |
Fri 17 October 2025 |
1106.50 (-4.05%) |
1152.80 |
1100.00 - 1156.90 |
0.8066 times |
Fri 10 October 2025 |
1153.20 (1.3%) |
1162.50 |
1141.00 - 1164.30 |
0.6327 times |
Fri 03 October 2025 |
1138.40 (0.77%) |
1135.60 |
1120.10 - 1167.90 |
0.5223 times |
Fri 26 September 2025 |
1129.70 (-6.42%) |
1207.20 |
1125.00 - 1207.20 |
1.0304 times |
Fri 19 September 2025 |
1207.20 (0.41%) |
1191.40 |
1190.00 - 1234.00 |
0.9551 times |
Fri 12 September 2025 |
1202.30 (1.07%) |
1189.60 |
1181.00 - 1234.90 |
1.4144 times |
Fri 05 September 2025 |
1189.60 (0.24%) |
1198.70 |
1184.00 - 1250.00 |
1.7913 times |
Fri 29 August 2025 |
1186.80 (-1.54%) |
1217.50 |
1179.50 - 1278.00 |
1.9006 times |
Fri 22 August 2025 |
1205.40 (1.09%) |
1208.00 |
1177.10 - 1218.80 |
1.2963 times |
Monthly price and charts CheviotCompany Strong monthly Stock price targets for CheviotCompany CHEVIOT are 1118.25 and 1206.05 | Monthly Target 1 | 1048.33 | | Monthly Target 2 | 1100.37 | | Monthly Target 3 | 1136.1333333333 | | Monthly Target 4 | 1188.17 | | Monthly Target 5 | 1223.93 |
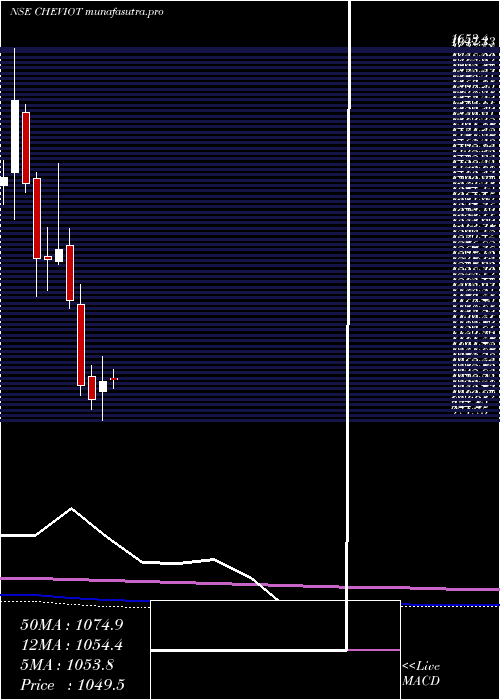
Monthly price and volumes Cheviot Company
| Date |
Closing |
Open |
Range |
Volume |
Tue 28 October 2025 |
1152.40 (1.02%) |
1138.00 |
1084.10 - 1171.90 |
0.3558 times |
Tue 30 September 2025 |
1140.80 (-3.88%) |
1198.70 |
1120.10 - 1250.00 |
0.7177 times |
Fri 29 August 2025 |
1186.80 (0.02%) |
1186.80 |
1147.70 - 1300.00 |
1.3565 times |
Thu 31 July 2025 |
1186.60 (-2.25%) |
1213.00 |
1151.00 - 1260.00 |
0.9642 times |
Mon 30 June 2025 |
1213.90 (11.64%) |
1091.00 |
1071.90 - 1265.00 |
1.3339 times |
Fri 30 May 2025 |
1087.30 (3.94%) |
1051.20 |
1019.30 - 1115.10 |
1.0671 times |
Wed 30 April 2025 |
1046.10 (3.22%) |
1028.15 |
974.75 - 1092.00 |
0.4253 times |
Fri 28 March 2025 |
1013.45 (-2.49%) |
1054.85 |
996.10 - 1074.95 |
1.7888 times |
Fri 28 February 2025 |
1039.30 (-13.01%) |
1187.00 |
1021.00 - 1224.00 |
0.8632 times |
Fri 31 January 2025 |
1194.80 (-7.19%) |
1294.10 |
1180.00 - 1325.00 |
1.1275 times |
Tue 31 December 2024 |
1287.30 (1.45%) |
1266.00 |
1260.00 - 1443.50 |
1.999 times |
DMA SMA EMA moving averages of Cheviot Company CHEVIOT
DMA (daily moving average) of Cheviot Company CHEVIOT
| DMA period | DMA value | | 5 day DMA | 1153.92 | | 12 day DMA | 1142.63 | | 20 day DMA | 1143.18 | | 35 day DMA | 1163.46 | | 50 day DMA | 1177.02 | | 100 day DMA | 1166.81 | | 150 day DMA | 1130.17 | | 200 day DMA | 1134.26 | EMA (exponential moving average) of Cheviot Company CHEVIOT
| EMA period | EMA current | EMA prev | EMA prev2 | | 5 day EMA | 1151.07 | 1150.41 | 1144.51 | | 12 day EMA | 1147.32 | 1146.4 | 1143.53 | | 20 day EMA | 1150.39 | 1150.18 | 1148.91 | | 35 day EMA | 1160.77 | 1161.26 | 1161.2 | | 50 day EMA | 1174.93 | 1175.85 | 1176.41 |
SMA (simple moving average) of Cheviot Company CHEVIOT
| SMA period | SMA current | SMA prev | SMA prev2 | | 5 day SMA | 1153.92 | 1149.3 | 1138.16 | | 12 day SMA | 1142.63 | 1142.18 | 1141.3 | | 20 day SMA | 1143.18 | 1142.04 | 1141.33 | | 35 day SMA | 1163.46 | 1164.52 | 1165.67 | | 50 day SMA | 1177.02 | 1177.54 | 1178.11 | | 100 day SMA | 1166.81 | 1166.21 | 1165.48 | | 150 day SMA | 1130.17 | 1129.44 | 1128.59 | | 200 day SMA | 1134.26 | 1134.82 | 1135.56 |
|
|
