ChemplastSanmar CHEMPLASTS full analysis,charts,indicators,moving averages,SMA,DMA,EMA,ADX,MACD,RSIChemplast Sanmar CHEMPLASTS WideScreen charts, DMA,SMA,EMA technical analysis, forecast prediction, by indicators ADX,MACD,RSI,CCI NSE stock exchange
Daily price and charts and targets ChemplastSanmar Strong Daily Stock price targets for ChemplastSanmar CHEMPLASTS are 389.5 and 405.8 | Daily Target 1 | 386.35 | | Daily Target 2 | 392.65 | | Daily Target 3 | 402.65 | | Daily Target 4 | 408.95 | | Daily Target 5 | 418.95 |
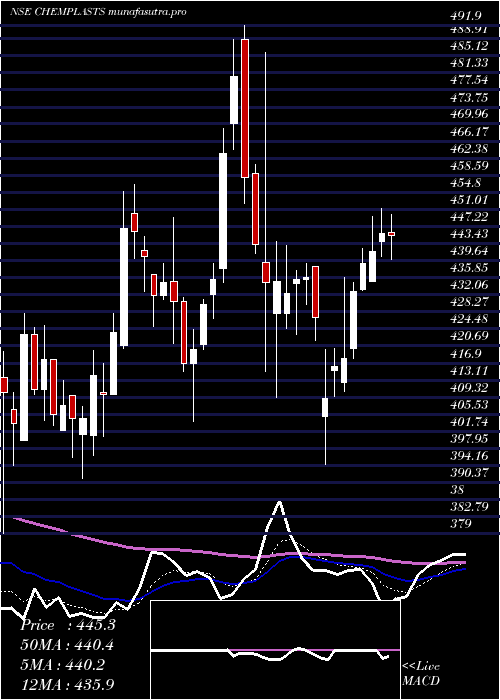
Daily price and volume Chemplast Sanmar
| Date |
Closing |
Open |
Range |
Volume |
Tue 28 October 2025 |
398.95 (-0.4%) |
403.70 |
396.35 - 412.65 |
0.7279 times |
Mon 27 October 2025 |
400.55 (1.3%) |
393.05 |
391.60 - 404.00 |
3.8629 times |
Fri 24 October 2025 |
395.40 (0%) |
391.80 |
386.10 - 397.15 |
0.5661 times |
Thu 23 October 2025 |
395.40 (0.66%) |
390.50 |
389.70 - 399.00 |
0.5929 times |
Tue 21 October 2025 |
392.80 (1.8%) |
387.80 |
386.50 - 395.00 |
0.1324 times |
Mon 20 October 2025 |
385.85 (-1.13%) |
390.25 |
383.00 - 391.55 |
0.1831 times |
Fri 17 October 2025 |
390.25 (-1.03%) |
393.85 |
389.40 - 395.75 |
0.3378 times |
Thu 16 October 2025 |
394.30 (4.46%) |
377.00 |
376.95 - 397.00 |
1.5113 times |
Wed 15 October 2025 |
377.45 (3.06%) |
366.25 |
365.55 - 378.55 |
1.5543 times |
Tue 14 October 2025 |
366.25 (-0.03%) |
365.00 |
365.00 - 372.35 |
0.5312 times |
Mon 13 October 2025 |
366.35 (0.07%) |
367.95 |
363.65 - 373.00 |
1.6088 times |
Weekly price and charts ChemplastSanmar Strong weekly Stock price targets for ChemplastSanmar CHEMPLASTS are 395.28 and 416.33 | Weekly Target 1 | 380.02 | | Weekly Target 2 | 389.48 | | Weekly Target 3 | 401.06666666667 | | Weekly Target 4 | 410.53 | | Weekly Target 5 | 422.12 |
Weekly price and volumes for Chemplast Sanmar
| Date |
Closing |
Open |
Range |
Volume |
Tue 28 October 2025 |
398.95 (0.9%) |
393.05 |
391.60 - 412.65 |
1.0899 times |
Fri 24 October 2025 |
395.40 (1.32%) |
390.25 |
383.00 - 399.00 |
0.3501 times |
Fri 17 October 2025 |
390.25 (6.6%) |
367.95 |
363.65 - 397.00 |
1.316 times |
Fri 10 October 2025 |
366.10 (-5.42%) |
388.00 |
362.75 - 392.35 |
0.8866 times |
Fri 03 October 2025 |
387.10 (-7.48%) |
420.60 |
378.85 - 421.75 |
1.9206 times |
Fri 26 September 2025 |
418.40 (-2.33%) |
427.00 |
410.90 - 427.70 |
0.3609 times |
Fri 19 September 2025 |
428.40 (-0.28%) |
427.05 |
422.80 - 451.30 |
2.8226 times |
Fri 12 September 2025 |
429.60 (3.26%) |
415.00 |
413.05 - 442.00 |
0.4687 times |
Fri 05 September 2025 |
416.05 (-2.63%) |
427.30 |
411.15 - 432.45 |
0.3848 times |
Fri 29 August 2025 |
427.30 (-2.71%) |
439.00 |
414.50 - 444.45 |
0.3999 times |
Fri 22 August 2025 |
439.20 (2.47%) |
439.95 |
437.40 - 460.80 |
1.2755 times |

Monthly price and charts ChemplastSanmar Strong monthly Stock price targets for ChemplastSanmar CHEMPLASTS are 380.85 and 430.75 | Monthly Target 1 | 341.55 | | Monthly Target 2 | 370.25 | | Monthly Target 3 | 391.45 | | Monthly Target 4 | 420.15 | | Monthly Target 5 | 441.35 |
Monthly price and volumes Chemplast Sanmar
| Date |
Closing |
Open |
Range |
Volume |
Tue 28 October 2025 |
398.95 (2.58%) |
389.50 |
362.75 - 412.65 |
1.0623 times |
Tue 30 September 2025 |
388.90 (-8.99%) |
427.30 |
380.00 - 451.30 |
1.3596 times |
Fri 29 August 2025 |
427.30 (2.51%) |
416.85 |
403.00 - 460.80 |
0.7242 times |
Thu 31 July 2025 |
416.85 (-5.06%) |
439.05 |
410.60 - 477.75 |
1.2446 times |
Mon 30 June 2025 |
439.05 (3.44%) |
418.80 |
405.00 - 449.90 |
0.8249 times |
Fri 30 May 2025 |
424.45 (3.36%) |
412.75 |
380.15 - 451.00 |
0.8305 times |
Wed 30 April 2025 |
410.65 (-5.61%) |
428.00 |
394.30 - 453.70 |
0.4483 times |
Fri 28 March 2025 |
435.05 (7.53%) |
400.90 |
396.35 - 491.90 |
1.7464 times |
Fri 28 February 2025 |
404.60 (-14.75%) |
468.95 |
379.00 - 484.80 |
0.9616 times |
Fri 31 January 2025 |
474.60 (-5.11%) |
495.60 |
443.70 - 518.60 |
0.7974 times |
Tue 31 December 2024 |
500.15 (-0.01%) |
505.00 |
471.95 - 530.00 |
1.5286 times |

DMA SMA EMA moving averages of Chemplast Sanmar CHEMPLASTS
DMA (daily moving average) of Chemplast Sanmar CHEMPLASTS
| DMA period | DMA value | | 5 day DMA | 396.62 | | 12 day DMA | 385.8 | | 20 day DMA | 383.32 | | 35 day DMA | 402.38 | | 50 day DMA | 411.19 | | 100 day DMA | 419.9 | | 150 day DMA | 422.74 | | 200 day DMA | 428.85 | EMA (exponential moving average) of Chemplast Sanmar CHEMPLASTS
| EMA period | EMA current | EMA prev | EMA prev2 | | 5 day EMA | 396.04 | 394.58 | 391.6 | | 12 day EMA | 391.31 | 389.92 | 387.99 | | 20 day EMA | 392.51 | 391.83 | 390.91 | | 35 day EMA | 398.72 | 398.71 | 398.6 | | 50 day EMA | 409.74 | 410.18 | 410.57 |
SMA (simple moving average) of Chemplast Sanmar CHEMPLASTS
| SMA period | SMA current | SMA prev | SMA prev2 | | 5 day SMA | 396.62 | 394 | 391.94 | | 12 day SMA | 385.8 | 383.36 | 380.41 | | 20 day SMA | 383.32 | 384.29 | 385.13 | | 35 day SMA | 402.38 | 402.87 | 403.59 | | 50 day SMA | 411.19 | 411.56 | 411.71 | | 100 day SMA | 419.9 | 420.17 | 420.46 | | 150 day SMA | 422.74 | 422.95 | 423.08 | | 200 day SMA | 428.85 | 429.3 | 429.78 |
|
|
