ChemconSpecial CHEMCON full analysis,charts,indicators,moving averages,SMA,DMA,EMA,ADX,MACD,RSIChemcon Special CHEMCON WideScreen charts, DMA,SMA,EMA technical analysis, forecast prediction, by indicators ADX,MACD,RSI,CCI NSE stock exchange
Daily price and charts and targets ChemconSpecial Strong Daily Stock price targets for ChemconSpecial CHEMCON are 243.83 and 247.18 | Daily Target 1 | 243 | | Daily Target 2 | 244.65 | | Daily Target 3 | 246.35 | | Daily Target 4 | 248 | | Daily Target 5 | 249.7 |
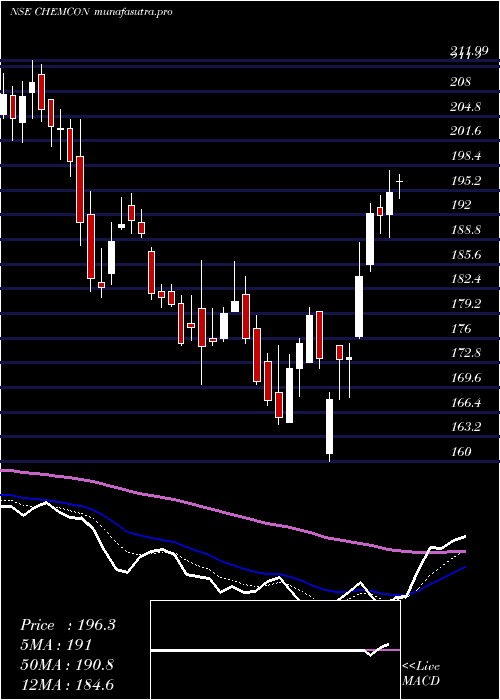
Daily price and volume Chemcon Special
| Date |
Closing |
Open |
Range |
Volume |
Tue 28 October 2025 |
246.30 (-0.32%) |
247.50 |
244.70 - 248.05 |
0.4069 times |
Mon 27 October 2025 |
247.10 (-0.42%) |
251.85 |
245.55 - 257.40 |
0.7952 times |
Fri 24 October 2025 |
248.15 (-1.31%) |
252.75 |
246.50 - 253.00 |
0.7901 times |
Thu 23 October 2025 |
251.45 (-4.25%) |
262.50 |
248.35 - 263.35 |
1.6566 times |
Tue 21 October 2025 |
262.60 (1.21%) |
259.45 |
257.55 - 265.00 |
0.2201 times |
Mon 20 October 2025 |
259.45 (-1.46%) |
264.00 |
257.65 - 264.10 |
0.7703 times |
Fri 17 October 2025 |
263.30 (-1.85%) |
267.00 |
262.10 - 267.85 |
0.8242 times |
Thu 16 October 2025 |
268.25 (-1.72%) |
273.95 |
266.10 - 274.15 |
1.1063 times |
Wed 15 October 2025 |
272.95 (2.75%) |
266.95 |
263.00 - 278.00 |
2.4386 times |
Tue 14 October 2025 |
265.65 (-1.72%) |
271.95 |
261.50 - 272.10 |
0.9917 times |
Mon 13 October 2025 |
270.30 (2.29%) |
263.70 |
256.30 - 280.95 |
4.9398 times |
Weekly price and charts ChemconSpecial Strong weekly Stock price targets for ChemconSpecial CHEMCON are 239.15 and 251.85 | Weekly Target 1 | 236.77 | | Weekly Target 2 | 241.53 | | Weekly Target 3 | 249.46666666667 | | Weekly Target 4 | 254.23 | | Weekly Target 5 | 262.17 |
Weekly price and volumes for Chemcon Special
| Date |
Closing |
Open |
Range |
Volume |
Tue 28 October 2025 |
246.30 (-0.75%) |
251.85 |
244.70 - 257.40 |
0.0517 times |
Fri 24 October 2025 |
248.15 (-5.75%) |
264.00 |
246.50 - 265.00 |
0.1478 times |
Fri 17 October 2025 |
263.30 (-0.36%) |
263.70 |
256.30 - 280.95 |
0.443 times |
Fri 10 October 2025 |
264.25 (-1.97%) |
272.00 |
261.05 - 288.30 |
0.9083 times |
Fri 03 October 2025 |
269.55 (1.55%) |
265.50 |
256.01 - 278.50 |
0.8887 times |
Fri 26 September 2025 |
265.44 (15.24%) |
232.49 |
230.70 - 295.00 |
6.8724 times |
Fri 19 September 2025 |
230.34 (-3.95%) |
239.79 |
229.20 - 247.00 |
0.0781 times |
Fri 12 September 2025 |
239.81 (15.11%) |
210.40 |
206.50 - 259.00 |
0.5308 times |
Fri 05 September 2025 |
208.33 (-0.23%) |
206.75 |
206.75 - 218.75 |
0.0411 times |
Fri 29 August 2025 |
208.82 (-7.96%) |
226.05 |
206.20 - 227.33 |
0.0381 times |
Fri 22 August 2025 |
226.88 (1.29%) |
225.20 |
221.81 - 233.87 |
0.0602 times |

Monthly price and charts ChemconSpecial Strong monthly Stock price targets for ChemconSpecial CHEMCON are 223.7 and 267.3 | Monthly Target 1 | 216.17 | | Monthly Target 2 | 231.23 | | Monthly Target 3 | 259.76666666667 | | Monthly Target 4 | 274.83 | | Monthly Target 5 | 303.37 |
Monthly price and volumes Chemcon Special
| Date |
Closing |
Open |
Range |
Volume |
Tue 28 October 2025 |
246.30 (-8.39%) |
269.00 |
244.70 - 288.30 |
1.3953 times |
Tue 30 September 2025 |
268.86 (28.75%) |
206.75 |
206.50 - 295.00 |
6.2102 times |
Fri 29 August 2025 |
208.82 (-14.4%) |
245.88 |
206.20 - 255.00 |
0.3943 times |
Thu 31 July 2025 |
243.94 (21.65%) |
201.50 |
192.98 - 252.75 |
0.8932 times |
Mon 30 June 2025 |
200.52 (1.92%) |
197.00 |
187.81 - 209.01 |
0.1595 times |
Fri 30 May 2025 |
196.75 (2.84%) |
191.00 |
180.90 - 223.50 |
0.2043 times |
Wed 30 April 2025 |
191.32 (15.5%) |
165.00 |
160.00 - 210.00 |
0.1744 times |
Fri 28 March 2025 |
165.65 (-13.25%) |
192.00 |
164.75 - 195.00 |
0.2851 times |
Fri 28 February 2025 |
190.96 (-11.47%) |
213.50 |
188.00 - 231.50 |
0.1479 times |
Fri 31 January 2025 |
215.70 (-4.55%) |
224.11 |
202.00 - 242.60 |
0.1358 times |
Tue 31 December 2024 |
225.99 (-6.8%) |
243.40 |
219.80 - 249.00 |
0.1254 times |

DMA SMA EMA moving averages of Chemcon Special CHEMCON
DMA (daily moving average) of Chemcon Special CHEMCON
| DMA period | DMA value | | 5 day DMA | 251.12 | | 12 day DMA | 259.98 | | 20 day DMA | 263.54 | | 35 day DMA | 254.73 | | 50 day DMA | 243.8 | | 100 day DMA | 226.5 | | 150 day DMA | 214.72 | | 200 day DMA | 212.46 | EMA (exponential moving average) of Chemcon Special CHEMCON
| EMA period | EMA current | EMA prev | EMA prev2 | | 5 day EMA | 250.74 | 252.96 | 255.89 | | 12 day EMA | 256.57 | 258.44 | 260.5 | | 20 day EMA | 257.21 | 258.36 | 259.54 | | 35 day EMA | 251.42 | 251.72 | 251.99 | | 50 day EMA | 243.17 | 243.04 | 242.87 |
SMA (simple moving average) of Chemcon Special CHEMCON
| SMA period | SMA current | SMA prev | SMA prev2 | | 5 day SMA | 251.12 | 253.75 | 256.99 | | 12 day SMA | 259.98 | 261.38 | 263.8 | | 20 day SMA | 263.54 | 264.5 | 266.31 | | 35 day SMA | 254.73 | 253.64 | 252.6 | | 50 day SMA | 243.8 | 243.43 | 243.06 | | 100 day SMA | 226.5 | 226.03 | 225.56 | | 150 day SMA | 214.72 | 214.24 | 213.78 | | 200 day SMA | 212.46 | 212.35 | 212.27 |
|
|
