ChembondChemicals CHEMBOND full analysis,charts,indicators,moving averages,SMA,DMA,EMA,ADX,MACD,RSIChembond Chemicals CHEMBOND WideScreen charts, DMA,SMA,EMA technical analysis, forecast prediction, by indicators ADX,MACD,RSI,CCI NSE stock exchange
Daily price and charts and targets ChembondChemicals Strong Daily Stock price targets for ChembondChemicals CHEMBOND are 164.76 and 171.39 | Daily Target 1 | 159.68 | | Daily Target 2 | 163.2 | | Daily Target 3 | 166.31333333333 | | Daily Target 4 | 169.83 | | Daily Target 5 | 172.94 |
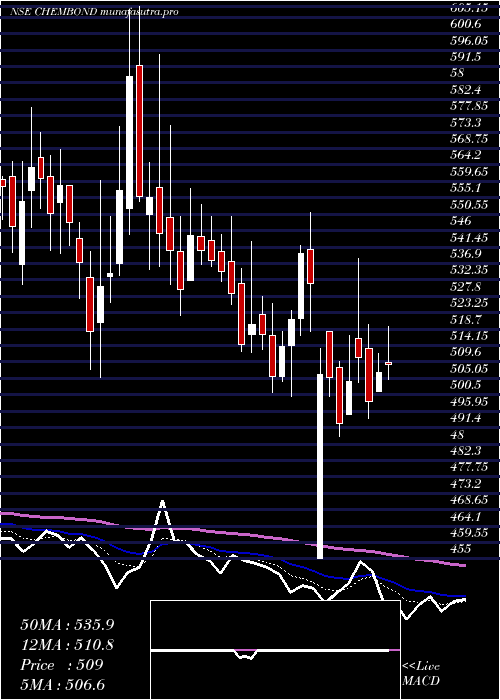
Daily price and volume Chembond Chemicals
| Date |
Closing |
Open |
Range |
Volume |
Tue 28 October 2025 |
166.71 (1.45%) |
162.80 |
162.80 - 169.43 |
0.669 times |
Mon 27 October 2025 |
164.33 (0.48%) |
164.40 |
163.22 - 166.67 |
0.5422 times |
Fri 24 October 2025 |
163.55 (-1.26%) |
166.17 |
162.90 - 166.46 |
0.8132 times |
Thu 23 October 2025 |
165.64 (-2.06%) |
170.00 |
164.12 - 171.59 |
0.8945 times |
Tue 21 October 2025 |
169.12 (3.4%) |
168.50 |
163.05 - 170.98 |
1.3022 times |
Mon 20 October 2025 |
163.56 (-1.88%) |
166.70 |
162.10 - 166.93 |
0.9049 times |
Fri 17 October 2025 |
166.70 (0.37%) |
166.99 |
162.00 - 169.90 |
1.0048 times |
Thu 16 October 2025 |
166.09 (0.5%) |
163.80 |
163.70 - 169.85 |
1.0562 times |
Wed 15 October 2025 |
165.26 (2.61%) |
161.90 |
161.60 - 166.79 |
0.9809 times |
Tue 14 October 2025 |
161.06 (-3.41%) |
167.00 |
159.00 - 170.35 |
1.832 times |
Mon 13 October 2025 |
166.75 (-1.73%) |
170.50 |
162.68 - 170.50 |
0.6857 times |
Weekly price and charts ChembondChemicals Strong weekly Stock price targets for ChembondChemicals CHEMBOND are 164.76 and 171.39 | Weekly Target 1 | 159.68 | | Weekly Target 2 | 163.2 | | Weekly Target 3 | 166.31333333333 | | Weekly Target 4 | 169.83 | | Weekly Target 5 | 172.94 |
Weekly price and volumes for Chembond Chemicals
| Date |
Closing |
Open |
Range |
Volume |
Tue 28 October 2025 |
166.71 (1.93%) |
164.40 |
162.80 - 169.43 |
0.1943 times |
Fri 24 October 2025 |
163.55 (-1.89%) |
166.70 |
162.10 - 171.59 |
0.6279 times |
Fri 17 October 2025 |
166.70 (-1.76%) |
170.50 |
159.00 - 170.50 |
0.8917 times |
Fri 10 October 2025 |
169.68 (-5.16%) |
180.80 |
163.55 - 185.50 |
1.1204 times |
Fri 03 October 2025 |
178.91 (7.31%) |
167.00 |
164.00 - 184.48 |
0.7966 times |
Fri 26 September 2025 |
166.73 (-7.11%) |
180.00 |
165.00 - 188.30 |
1.226 times |
Fri 19 September 2025 |
179.49 (-2.14%) |
184.40 |
178.02 - 196.54 |
0.5099 times |
Fri 12 September 2025 |
183.42 (4.29%) |
175.50 |
175.00 - 189.89 |
1.0168 times |
Fri 05 September 2025 |
175.88 (-27.76%) |
193.97 |
172.60 - 209.99 |
1.473 times |
Wed 28 May 2025 |
243.45 (-7.84%) |
269.40 |
241.50 - 270.80 |
2.1434 times |
Fri 23 May 2025 |
264.15 (-48.78%) |
523.85 |
258.90 - 567.00 |
2.1976 times |

Monthly price and charts ChembondChemicals Strong monthly Stock price targets for ChembondChemicals CHEMBOND are 149.61 and 176.11 | Monthly Target 1 | 143.9 | | Monthly Target 2 | 155.31 | | Monthly Target 3 | 170.40333333333 | | Monthly Target 4 | 181.81 | | Monthly Target 5 | 196.9 |
Monthly price and volumes Chembond Chemicals
| Date |
Closing |
Open |
Range |
Volume |
Tue 28 October 2025 |
166.71 (-5.79%) |
176.96 |
159.00 - 185.50 |
0.8366 times |
Tue 30 September 2025 |
176.95 (-27.32%) |
193.97 |
164.00 - 209.99 |
1.147 times |
Wed 28 May 2025 |
243.45 (-53.24%) |
519.50 |
241.50 - 567.00 |
1.117 times |
Wed 30 April 2025 |
520.60 (3%) |
505.45 |
455.00 - 554.45 |
0.9718 times |
Fri 28 March 2025 |
505.45 (-5.92%) |
533.10 |
501.00 - 608.00 |
1.0294 times |
Fri 28 February 2025 |
537.25 (-6.99%) |
569.00 |
527.20 - 599.00 |
0.7151 times |
Fri 31 January 2025 |
577.60 (-2.02%) |
590.95 |
551.05 - 625.00 |
0.9357 times |
Tue 31 December 2024 |
589.50 (2.76%) |
570.35 |
550.10 - 637.90 |
2.0324 times |
Fri 29 November 2024 |
573.65 (3.3%) |
560.00 |
538.95 - 605.00 |
0.4053 times |
Thu 31 October 2024 |
555.30 (-7.57%) |
603.70 |
526.00 - 630.00 |
0.8098 times |
Mon 30 September 2024 |
600.75 (-4.64%) |
633.30 |
591.50 - 638.10 |
0.9126 times |

DMA SMA EMA moving averages of Chembond Chemicals CHEMBOND
DMA (daily moving average) of Chembond Chemicals CHEMBOND
| DMA period | DMA value | | 5 day DMA | 165.87 | | 12 day DMA | 165.7 | | 20 day DMA | 169.15 | | 35 day DMA | 173.9 | | 50 day DMA | 223.86 | | 100 day DMA | 379.39 | | 150 day DMA | 446.68 | | 200 day DMA | 480.39 | EMA (exponential moving average) of Chembond Chemicals CHEMBOND
| EMA period | EMA current | EMA prev | EMA prev2 | | 5 day EMA | 165.6 | 165.04 | 165.39 | | 12 day EMA | 167.05 | 167.11 | 167.62 | | 20 day EMA | 175.03 | 175.91 | 177.13 | | 35 day EMA | 209.59 | 212.11 | 214.92 | | 50 day EMA | 243.11 | 246.23 | 249.57 |
SMA (simple moving average) of Chembond Chemicals CHEMBOND
| SMA period | SMA current | SMA prev | SMA prev2 | | 5 day SMA | 165.87 | 165.24 | 165.71 | | 12 day SMA | 165.7 | 165.68 | 166.03 | | 20 day SMA | 169.15 | 169.15 | 169.67 | | 35 day SMA | 173.9 | 174.16 | 174.56 | | 50 day SMA | 223.86 | 231.25 | 238.54 | | 100 day SMA | 379.39 | 383.52 | 387.63 | | 150 day SMA | 446.68 | 449.39 | 452.09 | | 200 day SMA | 480.39 | 482.62 | 484.88 |
|
|
