ChavdaInfra CHAVDA_SM full analysis,charts,indicators,moving averages,SMA,DMA,EMA,ADX,MACD,RSIChavda Infra CHAVDA_SM WideScreen charts, DMA,SMA,EMA technical analysis, forecast prediction, by indicators ADX,MACD,RSI,CCI NSE stock exchange
Daily price and charts and targets ChavdaInfra Strong Daily Stock price targets for ChavdaInfra CHAVDA_SM are 99.4 and 100.2 | Daily Target 1 | 98.73 | | Daily Target 2 | 99.27 | | Daily Target 3 | 99.533333333333 | | Daily Target 4 | 100.07 | | Daily Target 5 | 100.33 |
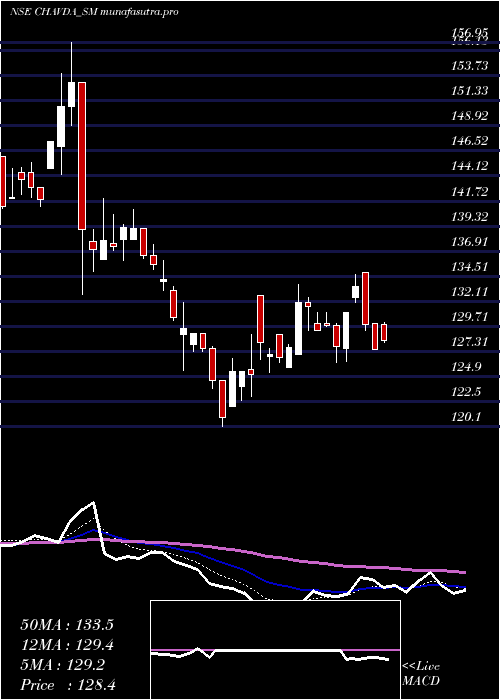
Daily price and volume Chavda Infra
| Date |
Closing |
Open |
Range |
Volume |
Mon 27 October 2025 |
99.80 (-0.3%) |
99.00 |
99.00 - 99.80 |
0.4945 times |
Fri 24 October 2025 |
100.10 (-1.81%) |
103.80 |
99.00 - 103.80 |
1.3736 times |
Thu 23 October 2025 |
101.95 (2%) |
100.65 |
100.50 - 103.40 |
1.0989 times |
Tue 21 October 2025 |
99.95 (1.22%) |
101.90 |
99.15 - 101.90 |
0.4945 times |
Mon 20 October 2025 |
98.75 (-0.45%) |
98.80 |
98.00 - 99.65 |
1.044 times |
Fri 17 October 2025 |
99.20 (-0.3%) |
100.90 |
98.75 - 101.35 |
0.8791 times |
Thu 16 October 2025 |
99.50 (-0.15%) |
99.75 |
98.50 - 100.95 |
1.2088 times |
Wed 15 October 2025 |
99.65 (0.15%) |
99.80 |
99.00 - 100.00 |
1.044 times |
Tue 14 October 2025 |
99.50 (-1.24%) |
100.75 |
99.50 - 101.20 |
1.3187 times |
Mon 13 October 2025 |
100.75 (-1.18%) |
100.00 |
100.00 - 102.60 |
1.044 times |
Fri 10 October 2025 |
101.95 (0.84%) |
103.40 |
101.40 - 103.50 |
1.3736 times |
Weekly price and charts ChavdaInfra Strong weekly Stock price targets for ChavdaInfra CHAVDA_SM are 99.4 and 100.2 | Weekly Target 1 | 98.73 | | Weekly Target 2 | 99.27 | | Weekly Target 3 | 99.533333333333 | | Weekly Target 4 | 100.07 | | Weekly Target 5 | 100.33 |
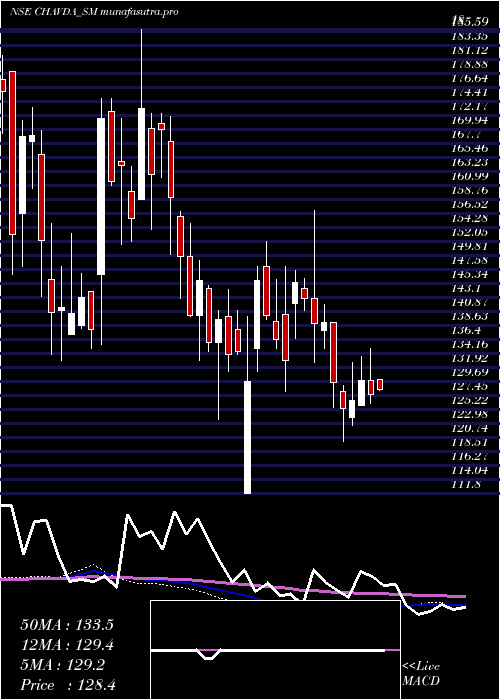
Weekly price and volumes for Chavda Infra
| Date |
Closing |
Open |
Range |
Volume |
Mon 27 October 2025 |
99.80 (-0.3%) |
99.00 |
99.00 - 99.80 |
0.0949 times |
Fri 24 October 2025 |
100.10 (0.91%) |
98.80 |
98.00 - 103.80 |
0.77 times |
Fri 17 October 2025 |
99.20 (-2.7%) |
100.00 |
98.50 - 102.60 |
1.0549 times |
Fri 10 October 2025 |
101.95 (-5.16%) |
105.50 |
100.70 - 105.95 |
1.4346 times |
Fri 03 October 2025 |
107.50 (0.51%) |
106.60 |
102.65 - 108.80 |
0.4325 times |
Fri 26 September 2025 |
106.95 (-6.59%) |
112.00 |
105.00 - 113.95 |
1.4557 times |
Fri 19 September 2025 |
114.50 (1.82%) |
112.05 |
111.40 - 117.00 |
0.981 times |
Fri 12 September 2025 |
112.45 (-1.83%) |
113.85 |
110.20 - 116.10 |
1.4451 times |
Fri 05 September 2025 |
114.55 (-4.14%) |
120.00 |
110.00 - 121.00 |
1.6983 times |
Fri 29 August 2025 |
119.50 (-5.94%) |
129.80 |
118.50 - 129.80 |
0.6329 times |
Fri 22 August 2025 |
127.05 (7.53%) |
120.00 |
118.00 - 133.80 |
2.7637 times |
Monthly price and charts ChavdaInfra Strong monthly Stock price targets for ChavdaInfra CHAVDA_SM are 93.5 and 104.3 | Monthly Target 1 | 91.4 | | Monthly Target 2 | 95.6 | | Monthly Target 3 | 102.2 | | Monthly Target 4 | 106.4 | | Monthly Target 5 | 113 |
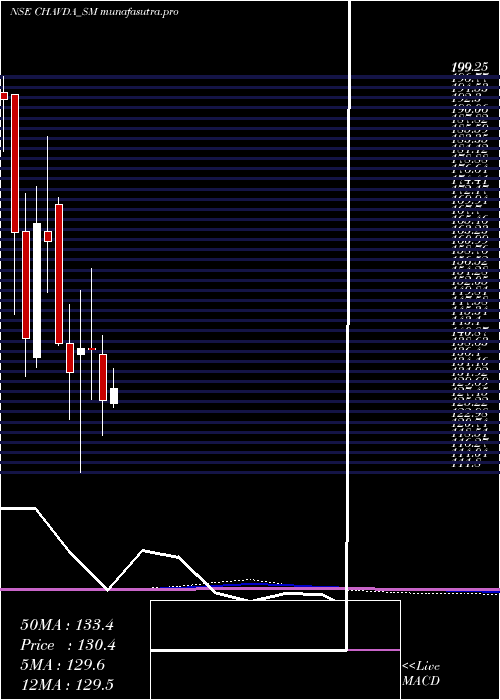
Monthly price and volumes Chavda Infra
| Date |
Closing |
Open |
Range |
Volume |
Mon 27 October 2025 |
99.80 (-5.49%) |
105.60 |
98.00 - 108.80 |
0.4623 times |
Tue 30 September 2025 |
105.60 (-11.63%) |
120.00 |
105.00 - 121.00 |
0.7173 times |
Fri 29 August 2025 |
119.50 (3.91%) |
114.90 |
107.00 - 133.80 |
0.708 times |
Thu 31 July 2025 |
115.00 (-9.95%) |
127.00 |
109.95 - 134.90 |
0.6775 times |
Mon 30 June 2025 |
127.70 (-8.1%) |
137.85 |
120.10 - 142.00 |
0.7917 times |
Fri 30 May 2025 |
138.95 (-0.14%) |
139.15 |
128.05 - 156.95 |
1.2832 times |
Wed 30 April 2025 |
139.15 (3.88%) |
137.90 |
111.80 - 152.00 |
1.254 times |
Fri 28 March 2025 |
133.95 (-4.49%) |
140.25 |
123.55 - 148.95 |
1.1663 times |
Fri 28 February 2025 |
140.25 (-13.85%) |
170.95 |
140.00 - 172.60 |
1.0016 times |
Fri 31 January 2025 |
162.80 (-2.46%) |
165.05 |
151.60 - 186.00 |
1.9381 times |
Tue 31 December 2024 |
166.90 (17.95%) |
137.25 |
135.00 - 174.90 |
3.0685 times |
DMA SMA EMA moving averages of Chavda Infra CHAVDA_SM
DMA (daily moving average) of Chavda Infra CHAVDA_SM
| DMA period | DMA value | | 5 day DMA | 100.11 | | 12 day DMA | 100.18 | | 20 day DMA | 102.19 | | 35 day DMA | 106.64 | | 50 day DMA | 110.54 | | 100 day DMA | 117.75 | | 150 day DMA | 124.84 | | 200 day DMA | 132.86 | EMA (exponential moving average) of Chavda Infra CHAVDA_SM
| EMA period | EMA current | EMA prev | EMA prev2 | | 5 day EMA | 100.15 | 100.33 | 100.44 | | 12 day EMA | 100.98 | 101.2 | 101.4 | | 20 day EMA | 102.68 | 102.98 | 103.28 | | 35 day EMA | 105.83 | 106.18 | 106.54 | | 50 day EMA | 109.38 | 109.77 | 110.16 |
SMA (simple moving average) of Chavda Infra CHAVDA_SM
| SMA period | SMA current | SMA prev | SMA prev2 | | 5 day SMA | 100.11 | 99.99 | 99.87 | | 12 day SMA | 100.18 | 100.5 | 100.78 | | 20 day SMA | 102.19 | 102.59 | 103.06 | | 35 day SMA | 106.64 | 107.02 | 107.39 | | 50 day SMA | 110.54 | 110.73 | 110.92 | | 100 day SMA | 117.75 | 118.13 | 118.5 | | 150 day SMA | 124.84 | 125.08 | 125.33 | | 200 day SMA | 132.86 | 133.2 | 133.54 |
|
|
