ChandanHealthcare CHANDAN_ST full analysis,charts,indicators,moving averages,SMA,DMA,EMA,ADX,MACD,RSIChandan Healthcare CHANDAN_ST WideScreen charts, DMA,SMA,EMA technical analysis, forecast prediction, by indicators ADX,MACD,RSI,CCI NSE stock exchange
Daily price and charts and targets ChandanHealthcare Strong Daily Stock price targets for ChandanHealthcare CHANDAN_ST are 315 and 343.9 | Daily Target 1 | 292.07 | | Daily Target 2 | 309.03 | | Daily Target 3 | 320.96666666667 | | Daily Target 4 | 337.93 | | Daily Target 5 | 349.87 |
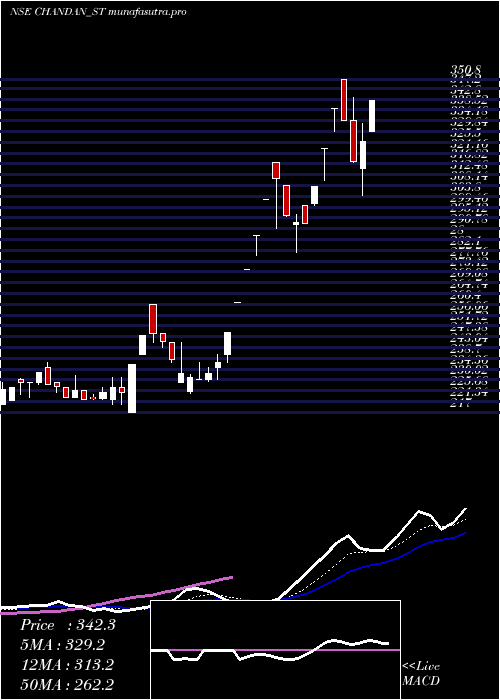
Daily price and volume Chandan Healthcare
| Date |
Closing |
Open |
Range |
Volume |
Tue 28 October 2025 |
326.00 (2.63%) |
314.90 |
304.00 - 332.90 |
0.3532 times |
Mon 27 October 2025 |
317.65 (-4.94%) |
334.15 |
317.45 - 343.60 |
0.3656 times |
Fri 24 October 2025 |
334.15 (-1.43%) |
350.80 |
334.15 - 350.80 |
0.4151 times |
Thu 23 October 2025 |
339.00 (4.95%) |
338.90 |
330.00 - 339.15 |
1.518 times |
Tue 21 October 2025 |
323.00 (4.99%) |
323.00 |
310.00 - 323.00 |
0.7683 times |
Mon 20 October 2025 |
307.65 (5%) |
301.00 |
300.00 - 307.65 |
0.8426 times |
Fri 17 October 2025 |
293.00 (-0.09%) |
300.00 |
293.00 - 300.00 |
0.0929 times |
Thu 16 October 2025 |
293.25 (-0.93%) |
292.60 |
281.20 - 296.45 |
0.4771 times |
Wed 15 October 2025 |
296.00 (-4.85%) |
308.00 |
295.55 - 308.00 |
0.9851 times |
Tue 14 October 2025 |
311.10 (2.88%) |
317.50 |
291.00 - 317.50 |
4.1822 times |
Mon 13 October 2025 |
302.40 (5%) |
302.40 |
302.40 - 302.40 |
0.3532 times |
Weekly price and charts ChandanHealthcare Strong weekly Stock price targets for ChandanHealthcare CHANDAN_ST are 295.2 and 334.8 | Weekly Target 1 | 284.93 | | Weekly Target 2 | 305.47 | | Weekly Target 3 | 324.53333333333 | | Weekly Target 4 | 345.07 | | Weekly Target 5 | 364.13 |
Weekly price and volumes for Chandan Healthcare
| Date |
Closing |
Open |
Range |
Volume |
Tue 28 October 2025 |
326.00 (-2.44%) |
334.15 |
304.00 - 343.60 |
0.2515 times |
Fri 24 October 2025 |
334.15 (14.04%) |
301.00 |
300.00 - 350.80 |
1.2402 times |
Fri 17 October 2025 |
293.00 (1.74%) |
302.40 |
281.20 - 317.50 |
2.1314 times |
Fri 10 October 2025 |
288.00 (23.82%) |
235.00 |
230.00 - 288.00 |
1.2619 times |
Fri 03 October 2025 |
232.60 (-2.41%) |
229.00 |
224.50 - 245.00 |
0.3469 times |
Fri 26 September 2025 |
238.35 (5.98%) |
217.00 |
217.00 - 260.25 |
3.3478 times |
Fri 19 September 2025 |
224.90 (-0.35%) |
225.70 |
220.00 - 231.00 |
0.8478 times |
Fri 12 September 2025 |
225.70 (-1.38%) |
228.85 |
223.00 - 237.00 |
0.1561 times |
Fri 05 September 2025 |
228.85 (4.47%) |
219.05 |
210.00 - 230.50 |
0.167 times |
Fri 29 August 2025 |
219.05 (-7.57%) |
227.00 |
215.00 - 234.00 |
0.2493 times |
Fri 22 August 2025 |
237.00 (-0.42%) |
243.00 |
229.00 - 244.40 |
0.167 times |

Monthly price and charts ChandanHealthcare Strong monthly Stock price targets for ChandanHealthcare CHANDAN_ST are 277.75 and 399.05 | Monthly Target 1 | 180.8 | | Monthly Target 2 | 253.4 | | Monthly Target 3 | 302.1 | | Monthly Target 4 | 374.7 | | Monthly Target 5 | 423.4 |
Monthly price and volumes Chandan Healthcare
| Date |
Closing |
Open |
Range |
Volume |
Tue 28 October 2025 |
326.00 (41.13%) |
230.00 |
229.50 - 350.80 |
1.2196 times |
Tue 30 September 2025 |
231.00 (5.46%) |
219.05 |
210.00 - 260.25 |
1.1143 times |
Fri 29 August 2025 |
219.05 (46.33%) |
243.00 |
215.00 - 267.00 |
0.1972 times |
Mon 03 March 2025 |
149.70 (-4.98%) |
157.55 |
149.70 - 160.80 |
0.0379 times |
Fri 28 February 2025 |
157.55 (0%) |
165.10 |
154.90 - 176.20 |
2.431 times |
Tue 28 October 2025 |
(0%) |
|
- |
0 times |

DMA SMA EMA moving averages of Chandan Healthcare CHANDAN_ST
DMA (daily moving average) of Chandan Healthcare CHANDAN_ST
| DMA period | DMA value | | 5 day DMA | 327.96 | | 12 day DMA | 310.93 | | 20 day DMA | 283.93 | | 35 day DMA | 261.56 | | 50 day DMA | 252 | | 100 day DMA | | | 150 day DMA | | | 200 day DMA | | EMA (exponential moving average) of Chandan Healthcare CHANDAN_ST
| EMA period | EMA current | EMA prev | EMA prev2 | | 5 day EMA | 322.69 | 321.03 | 322.72 | | 12 day EMA | 307.95 | 304.67 | 302.31 | | 20 day EMA | 292.81 | 289.32 | 286.34 | | 35 day EMA | 274.78 | 271.76 | 269.06 | | 50 day EMA | 258.34 | 255.58 | 253.05 |
SMA (simple moving average) of Chandan Healthcare CHANDAN_ST
| SMA period | SMA current | SMA prev | SMA prev2 | | 5 day SMA | 327.96 | 324.29 | 319.36 | | 12 day SMA | 310.93 | 306.63 | 301.93 | | 20 day SMA | 283.93 | 279.55 | 275.94 | | 35 day SMA | 261.56 | 258.78 | 256.24 | | 50 day SMA | 252 | 250.13 | 248.45 | | 100 day SMA | | 150 day SMA | | 200 day SMA |
|
|
