CreativeGraphics CGRAPHICS_SM full analysis,charts,indicators,moving averages,SMA,DMA,EMA,ADX,MACD,RSICreative Graphics CGRAPHICS_SM WideScreen charts, DMA,SMA,EMA technical analysis, forecast prediction, by indicators ADX,MACD,RSI,CCI NSE stock exchange
Daily price and charts and targets CreativeGraphics Strong Daily Stock price targets for CreativeGraphics CGRAPHICS_SM are 212.75 and 216.6 | Daily Target 1 | 209.6 | | Daily Target 2 | 212.05 | | Daily Target 3 | 213.45 | | Daily Target 4 | 215.9 | | Daily Target 5 | 217.3 |
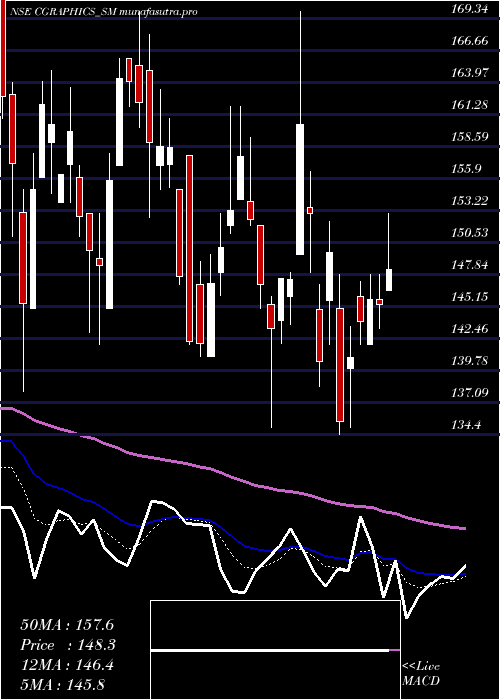
Daily price and volume Creative Graphics
| Date |
Closing |
Open |
Range |
Volume |
Wed 29 October 2025 |
214.50 (2.17%) |
211.00 |
211.00 - 214.85 |
0.3209 times |
Tue 28 October 2025 |
209.95 (0.14%) |
209.65 |
208.00 - 210.80 |
1.4439 times |
Mon 27 October 2025 |
209.65 (-1.34%) |
214.95 |
209.00 - 214.95 |
0.41 times |
Fri 24 October 2025 |
212.50 (1.02%) |
211.00 |
210.00 - 214.55 |
0.303 times |
Thu 23 October 2025 |
210.35 (-1.48%) |
213.55 |
207.90 - 213.55 |
1.0339 times |
Tue 21 October 2025 |
213.50 (-0.02%) |
218.90 |
212.00 - 220.00 |
0.2139 times |
Mon 20 October 2025 |
213.55 (-1%) |
215.70 |
211.50 - 218.95 |
0.9269 times |
Fri 17 October 2025 |
215.70 (0.7%) |
215.00 |
214.75 - 219.00 |
0.2317 times |
Thu 16 October 2025 |
214.20 (-0.33%) |
215.10 |
213.00 - 217.00 |
2.6381 times |
Wed 15 October 2025 |
214.90 (-1.58%) |
215.00 |
214.50 - 217.80 |
2.4777 times |
Tue 14 October 2025 |
218.35 (-1.2%) |
225.00 |
209.05 - 225.00 |
3.3868 times |
Weekly price and charts CreativeGraphics Strong weekly Stock price targets for CreativeGraphics CGRAPHICS_SM are 207.78 and 214.73 | Weekly Target 1 | 205.53 | | Weekly Target 2 | 210.02 | | Weekly Target 3 | 212.48333333333 | | Weekly Target 4 | 216.97 | | Weekly Target 5 | 219.43 |
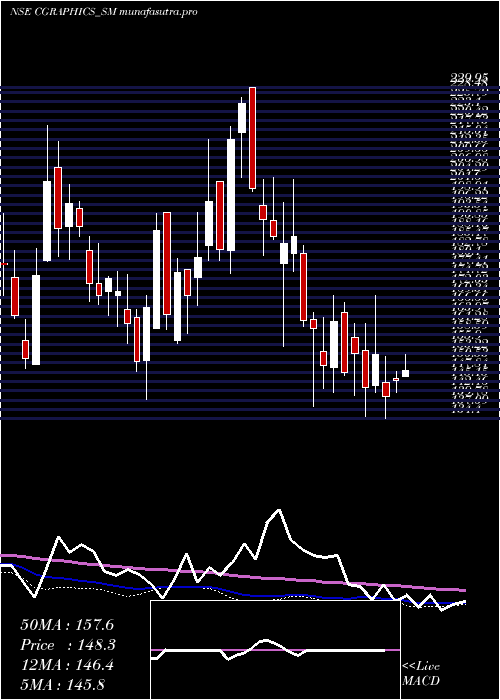
Weekly price and volumes for Creative Graphics
| Date |
Closing |
Open |
Range |
Volume |
Wed 29 October 2025 |
214.50 (0.94%) |
214.95 |
208.00 - 214.95 |
0.4592 times |
Fri 24 October 2025 |
212.50 (-1.48%) |
215.70 |
207.90 - 220.00 |
0.5231 times |
Fri 17 October 2025 |
215.70 (-3.81%) |
223.00 |
209.05 - 225.90 |
2.4238 times |
Fri 10 October 2025 |
224.25 (3.34%) |
233.70 |
214.00 - 233.70 |
1.5055 times |
Fri 03 October 2025 |
217.00 (-4.09%) |
224.00 |
207.95 - 224.25 |
0.542 times |
Fri 26 September 2025 |
226.25 (-5.02%) |
238.20 |
222.05 - 240.95 |
1.178 times |
Fri 19 September 2025 |
238.20 (3.68%) |
237.30 |
228.10 - 246.00 |
0.6398 times |
Fri 12 September 2025 |
229.75 (-2.52%) |
235.00 |
228.00 - 241.95 |
0.4968 times |
Fri 05 September 2025 |
235.70 (2.59%) |
226.05 |
224.95 - 259.00 |
1.4641 times |
Fri 29 August 2025 |
229.75 (7.13%) |
219.00 |
215.00 - 235.00 |
0.7678 times |
Fri 22 August 2025 |
214.45 (1.61%) |
213.15 |
211.00 - 240.90 |
1.8141 times |
Monthly price and charts CreativeGraphics Strong monthly Stock price targets for CreativeGraphics CGRAPHICS_SM are 198.3 and 224.1 | Monthly Target 1 | 192.9 | | Monthly Target 2 | 203.7 | | Monthly Target 3 | 218.7 | | Monthly Target 4 | 229.5 | | Monthly Target 5 | 244.5 |
Monthly price and volumes Creative Graphics
| Date |
Closing |
Open |
Range |
Volume |
Wed 29 October 2025 |
214.50 (1.95%) |
214.90 |
207.90 - 233.70 |
0.9964 times |
Tue 30 September 2025 |
210.40 (-8.42%) |
226.05 |
207.95 - 259.00 |
0.8008 times |
Fri 29 August 2025 |
229.75 (9.14%) |
211.00 |
202.50 - 240.90 |
0.7568 times |
Thu 31 July 2025 |
210.50 (4.21%) |
199.05 |
190.00 - 229.00 |
0.8572 times |
Mon 30 June 2025 |
202.00 (8.89%) |
182.00 |
170.15 - 210.00 |
1.2397 times |
Fri 30 May 2025 |
185.50 (29.95%) |
142.00 |
134.50 - 189.00 |
0.8191 times |
Wed 30 April 2025 |
142.75 (-0.38%) |
144.00 |
134.40 - 169.95 |
0.9107 times |
Fri 28 March 2025 |
143.30 (-4.4%) |
149.20 |
135.00 - 170.00 |
1.3378 times |
Fri 28 February 2025 |
149.90 (-18.93%) |
182.00 |
138.00 - 203.50 |
0.7634 times |
Fri 31 January 2025 |
184.90 (-14.97%) |
217.00 |
155.25 - 229.95 |
1.5181 times |
Tue 31 December 2024 |
217.45 (28.02%) |
175.00 |
167.10 - 226.00 |
3.9666 times |

DMA SMA EMA moving averages of Creative Graphics CGRAPHICS_SM
DMA (daily moving average) of Creative Graphics CGRAPHICS_SM
| DMA period | DMA value | | 5 day DMA | 211.39 | | 12 day DMA | 214.01 | | 20 day DMA | 216.09 | | 35 day DMA | 223.25 | | 50 day DMA | 225.11 | | 100 day DMA | 214.91 | | 150 day DMA | 194.83 | | 200 day DMA | 190.05 | EMA (exponential moving average) of Creative Graphics CGRAPHICS_SM
| EMA period | EMA current | EMA prev | EMA prev2 | | 5 day EMA | 212.36 | 211.29 | 211.96 | | 12 day EMA | 214.25 | 214.21 | 214.98 | | 20 day EMA | 216.64 | 216.87 | 217.6 | | 35 day EMA | 219.37 | 219.66 | 220.23 | | 50 day EMA | 222.57 | 222.9 | 223.43 |
SMA (simple moving average) of Creative Graphics CGRAPHICS_SM
| SMA period | SMA current | SMA prev | SMA prev2 | | 5 day SMA | 211.39 | 211.19 | 211.91 | | 12 day SMA | 214.01 | 214.83 | 216 | | 20 day SMA | 216.09 | 216.08 | 216.9 | | 35 day SMA | 223.25 | 223.81 | 224.54 | | 50 day SMA | 225.11 | 225.04 | 225.15 | | 100 day SMA | 214.91 | 214.66 | 214.37 | | 150 day SMA | 194.83 | 194.35 | 193.9 | | 200 day SMA | 190.05 | 190.1 | 190.15 |
|
|
