CapriGlobal CGCL full analysis,charts,indicators,moving averages,SMA,DMA,EMA,ADX,MACD,RSICapri Global CGCL WideScreen charts, DMA,SMA,EMA technical analysis, forecast prediction, by indicators ADX,MACD,RSI,CCI NSE stock exchange
operates under Finance (including NBFCs) sector
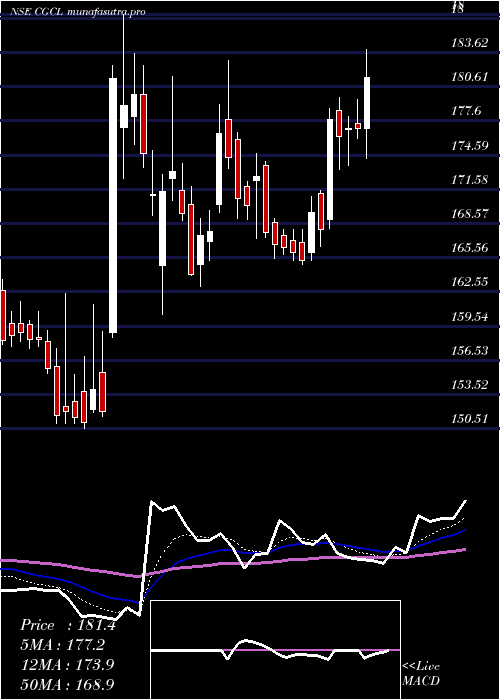
Daily price and charts and targets CapriGlobal Strong Daily Stock price targets for CapriGlobal CGCL are 204.84 and 212.44 | Daily Target 1 | 199.23 | | Daily Target 2 | 202.85 | | Daily Target 3 | 206.82666666667 | | Daily Target 4 | 210.45 | | Daily Target 5 | 214.43 |
Daily price and volume Capri Global
| Date |
Closing |
Open |
Range |
Volume |
Tue 28 October 2025 |
206.48 (1.26%) |
205.00 |
203.20 - 210.80 |
1.6199 times |
Mon 27 October 2025 |
203.92 (-0.51%) |
207.00 |
202.99 - 207.10 |
0.7032 times |
Fri 24 October 2025 |
204.96 (2.71%) |
202.00 |
201.15 - 208.20 |
3.0696 times |
Thu 23 October 2025 |
199.56 (3.14%) |
197.00 |
193.15 - 201.00 |
1.1954 times |
Tue 21 October 2025 |
193.49 (0.17%) |
193.95 |
192.80 - 194.40 |
0.0735 times |
Mon 20 October 2025 |
193.16 (0.55%) |
192.10 |
190.11 - 194.50 |
0.436 times |
Fri 17 October 2025 |
192.10 (-0.55%) |
194.41 |
190.00 - 194.50 |
0.3189 times |
Thu 16 October 2025 |
193.16 (-0.36%) |
196.80 |
192.00 - 197.00 |
0.7168 times |
Wed 15 October 2025 |
193.86 (4.34%) |
185.80 |
185.10 - 196.65 |
1.5811 times |
Tue 14 October 2025 |
185.79 (-1.05%) |
187.76 |
184.42 - 188.83 |
0.2855 times |
Mon 13 October 2025 |
187.76 (-1.05%) |
188.00 |
187.00 - 188.96 |
0.2732 times |
Weekly price and charts CapriGlobal Strong weekly Stock price targets for CapriGlobal CGCL are 200.83 and 208.64 | Weekly Target 1 | 198.95 | | Weekly Target 2 | 202.71 | | Weekly Target 3 | 206.75666666667 | | Weekly Target 4 | 210.52 | | Weekly Target 5 | 214.57 |
Weekly price and volumes for Capri Global
| Date |
Closing |
Open |
Range |
Volume |
Tue 28 October 2025 |
206.48 (0.74%) |
207.00 |
202.99 - 210.80 |
0.726 times |
Fri 24 October 2025 |
204.96 (6.69%) |
192.10 |
190.11 - 208.20 |
1.4922 times |
Fri 17 October 2025 |
192.10 (1.23%) |
188.00 |
184.42 - 197.00 |
0.9924 times |
Fri 10 October 2025 |
189.76 (0.22%) |
190.00 |
185.17 - 192.85 |
0.4723 times |
Fri 03 October 2025 |
189.34 (2.2%) |
185.80 |
184.00 - 190.99 |
0.6361 times |
Fri 26 September 2025 |
185.26 (-2.83%) |
191.00 |
184.00 - 198.40 |
0.8963 times |
Fri 19 September 2025 |
190.66 (2.48%) |
186.90 |
184.10 - 195.00 |
1.4902 times |
Fri 12 September 2025 |
186.04 (0.85%) |
185.40 |
182.47 - 191.80 |
0.6666 times |
Fri 05 September 2025 |
184.48 (-0.47%) |
185.90 |
183.10 - 192.50 |
0.6282 times |
Fri 29 August 2025 |
185.36 (-1.38%) |
188.90 |
181.59 - 193.99 |
1.9997 times |
Fri 22 August 2025 |
187.96 (1.13%) |
187.50 |
186.51 - 194.70 |
1.2526 times |
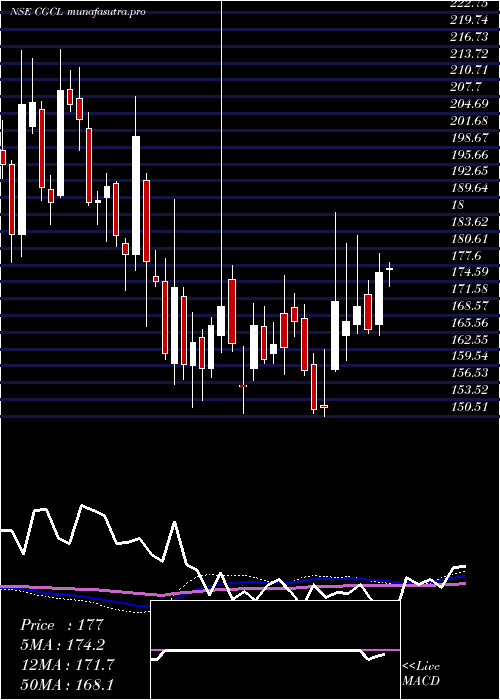
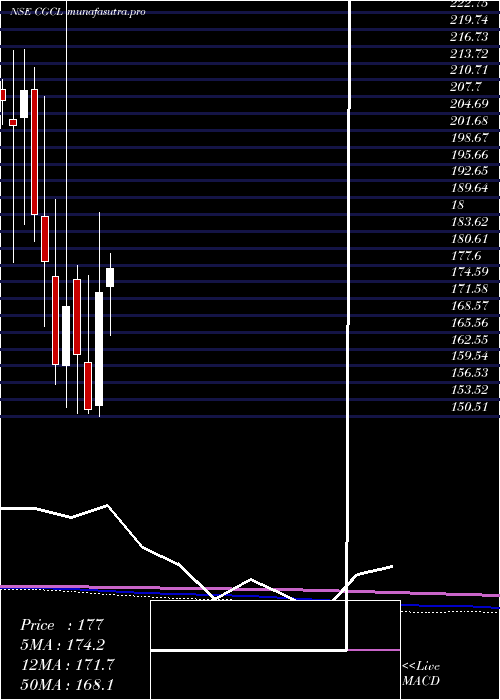
Monthly price and charts CapriGlobal Strong monthly Stock price targets for CapriGlobal CGCL are 195.45 and 221.83 | Monthly Target 1 | 174.19 | | Monthly Target 2 | 190.33 | | Monthly Target 3 | 200.56666666667 | | Monthly Target 4 | 216.71 | | Monthly Target 5 | 226.95 |
Monthly price and volumes Capri Global
| Date |
Closing |
Open |
Range |
Volume |
Tue 28 October 2025 |
206.48 (11.5%) |
185.40 |
184.42 - 210.80 |
0.3979 times |
Tue 30 September 2025 |
185.18 (-0.1%) |
185.90 |
182.47 - 198.40 |
0.4032 times |
Fri 29 August 2025 |
185.36 (-0.5%) |
186.50 |
174.90 - 195.90 |
1.1076 times |
Thu 31 July 2025 |
186.29 (7.87%) |
173.68 |
165.00 - 190.30 |
1.129 times |
Mon 30 June 2025 |
172.70 (13.85%) |
152.49 |
150.51 - 186.95 |
3.1585 times |
Fri 30 May 2025 |
151.69 (-6.11%) |
160.21 |
150.99 - 175.80 |
0.2806 times |
Wed 30 April 2025 |
161.56 (-5.08%) |
175.00 |
151.09 - 177.50 |
0.5728 times |
Fri 28 March 2025 |
170.21 (6.57%) |
159.70 |
152.11 - 231.35 |
2.3902 times |
Fri 28 February 2025 |
159.72 (-10.34%) |
175.60 |
156.22 - 189.35 |
0.057 times |
Fri 31 January 2025 |
178.13 (-4.55%) |
186.30 |
166.62 - 207.75 |
0.5033 times |
Tue 31 December 2024 |
186.63 (-10.65%) |
208.95 |
181.80 - 213.00 |
0.0268 times |
DMA SMA EMA moving averages of Capri Global CGCL
DMA (daily moving average) of Capri Global CGCL
| DMA period | DMA value | | 5 day DMA | 201.68 | | 12 day DMA | 195.33 | | 20 day DMA | 192.59 | | 35 day DMA | 190.8 | | 50 day DMA | 189.91 | | 100 day DMA | 183.02 | | 150 day DMA | 176.5 | | 200 day DMA | 175.57 | EMA (exponential moving average) of Capri Global CGCL
| EMA period | EMA current | EMA prev | EMA prev2 | | 5 day EMA | 202.23 | 200.11 | 198.21 | | 12 day EMA | 197.43 | 195.79 | 194.31 | | 20 day EMA | 194.77 | 193.54 | 192.45 | | 35 day EMA | 192.21 | 191.37 | 190.63 | | 50 day EMA | 190.68 | 190.04 | 189.47 |
SMA (simple moving average) of Capri Global CGCL
| SMA period | SMA current | SMA prev | SMA prev2 | | 5 day SMA | 201.68 | 199.02 | 196.65 | | 12 day SMA | 195.33 | 193.95 | 192.72 | | 20 day SMA | 192.59 | 191.53 | 190.76 | | 35 day SMA | 190.8 | 190.17 | 189.64 | | 50 day SMA | 189.91 | 189.5 | 189.07 | | 100 day SMA | 183.02 | 182.47 | 181.94 | | 150 day SMA | 176.5 | 176.21 | 175.9 | | 200 day SMA | 175.57 | 175.45 | 175.39 |
|
|
