CentralBank CENTRALBK full analysis,charts,indicators,moving averages,SMA,DMA,EMA,ADX,MACD,RSICentral Bank CENTRALBK WideScreen charts, DMA,SMA,EMA technical analysis, forecast prediction, by indicators ADX,MACD,RSI,CCI NSE stock exchange
operates under Banks sector
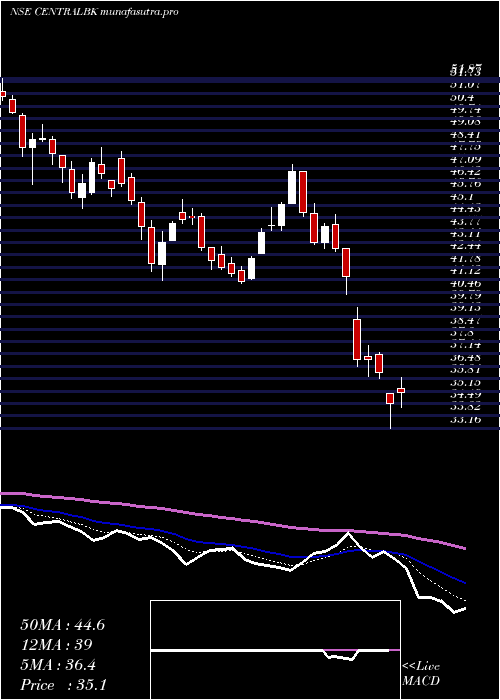
Daily price and charts and targets CentralBank Strong Daily Stock price targets for CentralBank CENTRALBK are 36.5 and 37.19 | Daily Target 1 | 36.37 | | Daily Target 2 | 36.63 | | Daily Target 3 | 37.06 | | Daily Target 4 | 37.32 | | Daily Target 5 | 37.75 |
Daily price and volume Central Bank
| Date |
Closing |
Open |
Range |
Volume |
Fri 05 December 2025 |
36.89 (-0.46%) |
37.05 |
36.80 - 37.49 |
1.3669 times |
Thu 04 December 2025 |
37.06 (-0.59%) |
37.19 |
36.96 - 37.57 |
0.8071 times |
Wed 03 December 2025 |
37.28 (-2.36%) |
38.14 |
37.10 - 38.19 |
1.232 times |
Tue 02 December 2025 |
38.18 (-0.68%) |
38.44 |
37.87 - 38.94 |
1.1365 times |
Mon 01 December 2025 |
38.44 (0.18%) |
38.50 |
38.10 - 39.04 |
1.1523 times |
Fri 28 November 2025 |
38.37 (-0.93%) |
38.75 |
38.27 - 38.75 |
0.5456 times |
Thu 27 November 2025 |
38.73 (-0.05%) |
38.94 |
38.50 - 39.04 |
0.6498 times |
Wed 26 November 2025 |
38.75 (1.07%) |
38.49 |
38.35 - 39.47 |
1.439 times |
Tue 25 November 2025 |
38.34 (1.4%) |
37.90 |
37.75 - 38.54 |
0.7873 times |
Mon 24 November 2025 |
37.81 (-0.6%) |
38.20 |
37.70 - 38.44 |
0.8835 times |
Fri 21 November 2025 |
38.04 (-1.55%) |
38.55 |
38.00 - 38.70 |
0.8094 times |
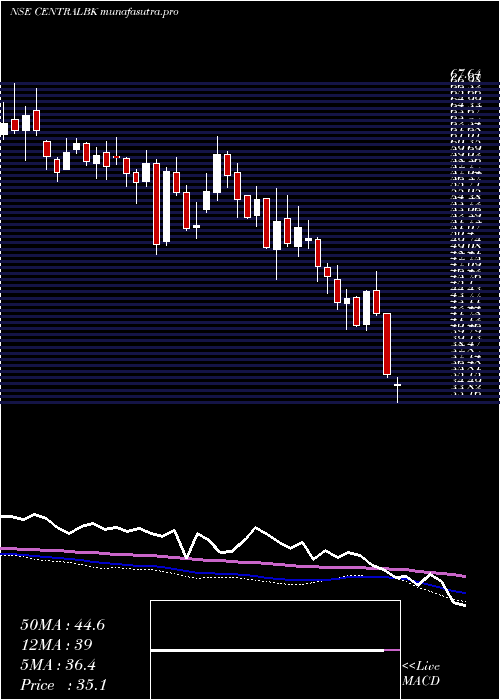
Weekly price and charts CentralBank Strong weekly Stock price targets for CentralBank CENTRALBK are 35.73 and 37.97 | Weekly Target 1 | 35.34 | | Weekly Target 2 | 36.11 | | Weekly Target 3 | 37.576666666667 | | Weekly Target 4 | 38.35 | | Weekly Target 5 | 39.82 |
Weekly price and volumes for Central Bank
| Date |
Closing |
Open |
Range |
Volume |
Fri 05 December 2025 |
36.89 (-3.86%) |
38.50 |
36.80 - 39.04 |
0.8119 times |
Fri 28 November 2025 |
38.37 (0.87%) |
38.20 |
37.70 - 39.47 |
0.6138 times |
Fri 21 November 2025 |
38.04 (0.34%) |
38.09 |
37.91 - 39.75 |
1.2108 times |
Fri 14 November 2025 |
37.91 (-2.7%) |
39.01 |
37.24 - 39.19 |
0.887 times |
Fri 07 November 2025 |
38.96 (-1.32%) |
39.70 |
37.47 - 40.53 |
1.0176 times |
Fri 31 October 2025 |
39.48 (1.05%) |
39.06 |
38.90 - 40.65 |
1.6569 times |
Fri 24 October 2025 |
39.07 (5.82%) |
37.10 |
36.76 - 40.20 |
1.4975 times |
Fri 17 October 2025 |
36.92 (-3.15%) |
37.99 |
36.66 - 38.78 |
0.9269 times |
Fri 10 October 2025 |
38.12 (0.85%) |
38.00 |
37.02 - 38.70 |
0.71 times |
Fri 03 October 2025 |
37.80 (4.39%) |
36.21 |
36.08 - 38.20 |
0.6675 times |
Fri 26 September 2025 |
36.21 (-5.21%) |
38.20 |
36.10 - 38.75 |
0.7747 times |
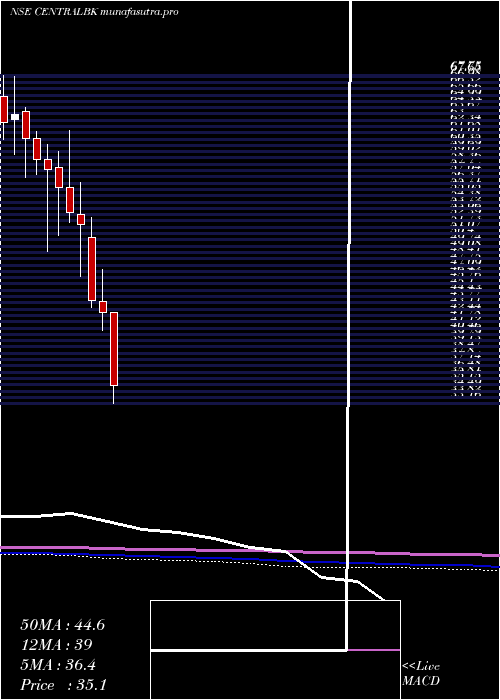
Monthly price and charts CentralBank Strong monthly Stock price targets for CentralBank CENTRALBK are 35.73 and 37.97 | Monthly Target 1 | 35.34 | | Monthly Target 2 | 36.11 | | Monthly Target 3 | 37.576666666667 | | Monthly Target 4 | 38.35 | | Monthly Target 5 | 39.82 |
Monthly price and volumes Central Bank
| Date |
Closing |
Open |
Range |
Volume |
Fri 05 December 2025 |
36.89 (-3.86%) |
38.50 |
36.80 - 39.04 |
0.1917 times |
Fri 28 November 2025 |
38.37 (-2.81%) |
39.70 |
37.24 - 40.53 |
0.8806 times |
Fri 31 October 2025 |
39.48 (4.5%) |
37.90 |
36.66 - 40.65 |
1.2116 times |
Tue 30 September 2025 |
37.78 (9.44%) |
34.66 |
34.52 - 38.75 |
0.6879 times |
Fri 29 August 2025 |
34.52 (-5.19%) |
36.41 |
34.22 - 37.08 |
0.4293 times |
Thu 31 July 2025 |
36.41 (-8.19%) |
39.84 |
35.88 - 40.69 |
0.9784 times |
Mon 30 June 2025 |
39.66 (1.85%) |
39.39 |
36.37 - 41.20 |
1.9366 times |
Fri 30 May 2025 |
38.94 (5.07%) |
37.02 |
32.75 - 39.48 |
1.2252 times |
Wed 30 April 2025 |
37.06 (-13.35%) |
42.79 |
33.16 - 42.79 |
1.9555 times |
Fri 28 March 2025 |
42.77 (-2.75%) |
43.90 |
40.89 - 47.30 |
0.5032 times |
Fri 28 February 2025 |
43.98 (-15.5%) |
50.67 |
43.25 - 52.81 |
0.3609 times |
DMA SMA EMA moving averages of Central Bank CENTRALBK
DMA (daily moving average) of Central Bank CENTRALBK
| DMA period | DMA value | | 5 day DMA | 37.57 | | 12 day DMA | 38.04 | | 20 day DMA | 38.18 | | 35 day DMA | 38.58 | | 50 day DMA | 38.24 | | 100 day DMA | 37.39 | | 150 day DMA | 37.63 | | 200 day DMA | 38.58 | EMA (exponential moving average) of Central Bank CENTRALBK
| EMA period | EMA current | EMA prev | EMA prev2 | | 5 day EMA | 37.42 | 37.69 | 38.01 | | 12 day EMA | 37.9 | 38.08 | 38.26 | | 20 day EMA | 38.11 | 38.24 | 38.36 | | 35 day EMA | 38.12 | 38.19 | 38.26 | | 50 day EMA | 38.14 | 38.19 | 38.24 |
SMA (simple moving average) of Central Bank CENTRALBK
| SMA period | SMA current | SMA prev | SMA prev2 | | 5 day SMA | 37.57 | 37.87 | 38.2 | | 12 day SMA | 38.04 | 38.26 | 38.41 | | 20 day SMA | 38.18 | 38.28 | 38.33 | | 35 day SMA | 38.58 | 38.61 | 38.6 | | 50 day SMA | 38.24 | 38.26 | 38.27 | | 100 day SMA | 37.39 | 37.4 | 37.42 | | 150 day SMA | 37.63 | 37.63 | 37.63 | | 200 day SMA | 38.58 | 38.63 | 38.69 |
|
|
