CellPoint CELLPOINT_SM full analysis,charts,indicators,moving averages,SMA,DMA,EMA,ADX,MACD,RSICell Point CELLPOINT_SM WideScreen charts, DMA,SMA,EMA technical analysis, forecast prediction, by indicators ADX,MACD,RSI,CCI NSE stock exchange
Daily price and charts and targets CellPoint Strong Daily Stock price targets for CellPoint CELLPOINT_SM are 16.5 and 17.6 | Daily Target 1 | 15.62 | | Daily Target 2 | 16.28 | | Daily Target 3 | 16.716666666667 | | Daily Target 4 | 17.38 | | Daily Target 5 | 17.82 |
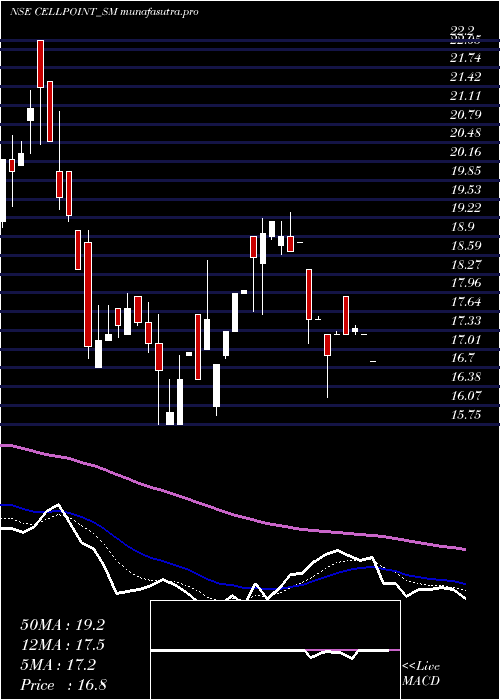
Daily price and volume Cell Point
| Date |
Closing |
Open |
Range |
Volume |
Tue 09 December 2025 |
16.95 (2.73%) |
16.05 |
16.05 - 17.15 |
0.9259 times |
Mon 08 December 2025 |
16.50 (-5.17%) |
17.00 |
16.50 - 17.05 |
2.4074 times |
Fri 05 December 2025 |
17.40 (1.46%) |
17.00 |
17.00 - 17.40 |
0.3704 times |
Thu 04 December 2025 |
17.15 (0.88%) |
17.15 |
17.15 - 17.20 |
0.5556 times |
Wed 03 December 2025 |
17.00 (0%) |
17.00 |
17.00 - 17.00 |
0.1852 times |
Tue 02 December 2025 |
17.00 (-1.73%) |
17.70 |
16.90 - 18.00 |
2.5926 times |
Mon 01 December 2025 |
17.30 (-5.21%) |
17.50 |
17.00 - 17.50 |
1.2963 times |
Thu 27 November 2025 |
18.25 (4.29%) |
17.35 |
17.35 - 18.25 |
0.3704 times |
Tue 25 November 2025 |
17.50 (2.94%) |
17.45 |
17.45 - 17.50 |
0.7407 times |
Mon 24 November 2025 |
17.00 (-0.87%) |
17.50 |
17.00 - 17.50 |
0.5556 times |
Fri 21 November 2025 |
17.15 (-4.72%) |
18.00 |
17.00 - 18.00 |
1.4815 times |
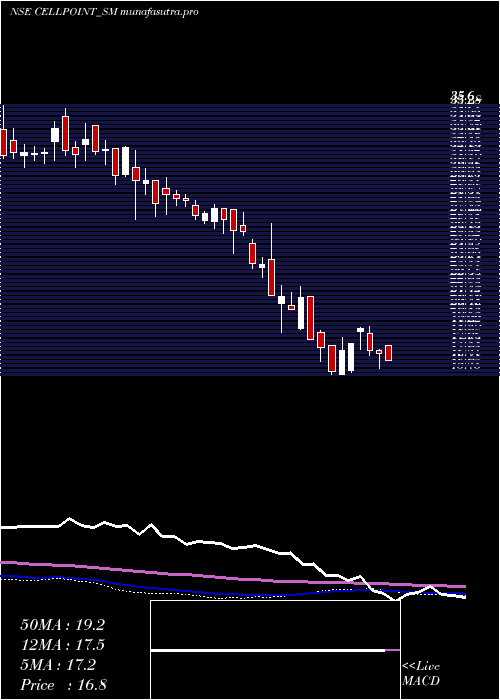
Weekly price and charts CellPoint Strong weekly Stock price targets for CellPoint CELLPOINT_SM are 15.95 and 17.05 | Weekly Target 1 | 15.62 | | Weekly Target 2 | 16.28 | | Weekly Target 3 | 16.716666666667 | | Weekly Target 4 | 17.38 | | Weekly Target 5 | 17.82 |
Weekly price and volumes for Cell Point
| Date |
Closing |
Open |
Range |
Volume |
Tue 09 December 2025 |
16.95 (-2.59%) |
17.00 |
16.05 - 17.15 |
0.9278 times |
Fri 05 December 2025 |
17.40 (-4.66%) |
17.50 |
16.90 - 18.00 |
1.3918 times |
Thu 27 November 2025 |
18.25 (6.41%) |
17.50 |
17.00 - 18.25 |
0.4639 times |
Fri 21 November 2025 |
17.15 (-8.04%) |
17.00 |
17.00 - 18.05 |
1.7526 times |
Thu 13 November 2025 |
18.65 (3.61%) |
18.10 |
17.15 - 19.50 |
1.701 times |
Fri 07 November 2025 |
18.00 (0.28%) |
17.75 |
17.45 - 18.80 |
0.5155 times |
Fri 31 October 2025 |
17.95 (1.13%) |
17.75 |
17.00 - 18.40 |
1.1856 times |
Thu 23 October 2025 |
17.75 (-2.47%) |
17.60 |
17.35 - 18.00 |
0.3093 times |
Fri 17 October 2025 |
18.20 (-3.96%) |
18.50 |
18.20 - 18.95 |
0.6701 times |
Fri 10 October 2025 |
18.95 (-1.04%) |
18.75 |
18.00 - 19.00 |
1.0825 times |
Fri 03 October 2025 |
19.15 (2.96%) |
17.60 |
17.60 - 19.15 |
0.3093 times |
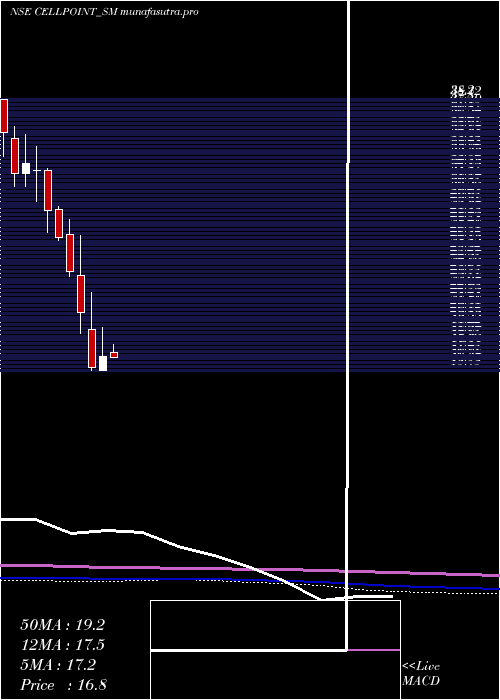
Monthly price and charts CellPoint Strong monthly Stock price targets for CellPoint CELLPOINT_SM are 15.53 and 17.48 | Monthly Target 1 | 15.05 | | Monthly Target 2 | 16 | | Monthly Target 3 | 17 | | Monthly Target 4 | 17.95 | | Monthly Target 5 | 18.95 |
Monthly price and volumes Cell Point
| Date |
Closing |
Open |
Range |
Volume |
Tue 09 December 2025 |
16.95 (-7.12%) |
17.50 |
16.05 - 18.00 |
0.2964 times |
Thu 27 November 2025 |
18.25 (1.67%) |
17.75 |
17.00 - 19.50 |
0.5665 times |
Fri 31 October 2025 |
17.95 (-1.1%) |
19.15 |
17.00 - 19.15 |
0.4216 times |
Tue 30 September 2025 |
18.15 (3.12%) |
17.95 |
17.50 - 20.50 |
0.7773 times |
Fri 29 August 2025 |
17.60 (-2.76%) |
18.65 |
16.45 - 19.55 |
1.0606 times |
Wed 30 July 2025 |
18.10 (-1.36%) |
18.10 |
17.80 - 21.15 |
0.8498 times |
Mon 30 June 2025 |
18.35 (-8.48%) |
20.20 |
18.05 - 20.95 |
1.1001 times |
Fri 30 May 2025 |
20.05 (18.64%) |
17.25 |
16.60 - 20.20 |
0.9025 times |
Wed 30 April 2025 |
16.90 (5.96%) |
15.75 |
15.75 - 19.30 |
0.8169 times |
Fri 28 March 2025 |
15.95 (-22.38%) |
19.15 |
15.75 - 22.20 |
3.2082 times |
Fri 28 February 2025 |
20.55 (-14.02%) |
23.65 |
18.80 - 26.90 |
1.4822 times |
DMA SMA EMA moving averages of Cell Point CELLPOINT_SM
DMA (daily moving average) of Cell Point CELLPOINT_SM
| DMA period | DMA value | | 5 day DMA | 17 | | 12 day DMA | 17.27 | | 20 day DMA | 17.58 | | 35 day DMA | 17.71 | | 50 day DMA | 18.01 | | 100 day DMA | 18.21 | | 150 day DMA | 18.23 | | 200 day DMA | 18.83 | EMA (exponential moving average) of Cell Point CELLPOINT_SM
| EMA period | EMA current | EMA prev | EMA prev2 | | 5 day EMA | 17 | 17.02 | 17.28 | | 12 day EMA | 17.24 | 17.29 | 17.43 | | 20 day EMA | 17.42 | 17.47 | 17.57 | | 35 day EMA | 17.72 | 17.77 | 17.85 | | 50 day EMA | 17.95 | 17.99 | 18.05 |
SMA (simple moving average) of Cell Point CELLPOINT_SM
| SMA period | SMA current | SMA prev | SMA prev2 | | 5 day SMA | 17 | 17.01 | 17.17 | | 12 day SMA | 17.27 | 17.29 | 17.4 | | 20 day SMA | 17.58 | 17.64 | 17.71 | | 35 day SMA | 17.71 | 17.77 | 17.81 | | 50 day SMA | 18.01 | 18.04 | 18.09 | | 100 day SMA | 18.21 | 18.22 | 18.25 | | 150 day SMA | 18.23 | 18.23 | 18.23 | | 200 day SMA | 18.83 | 18.88 | 18.93 |
|
|
