CeigallIndia CEIGALL full analysis,charts,indicators,moving averages,SMA,DMA,EMA,ADX,MACD,RSICeigall India CEIGALL WideScreen charts, DMA,SMA,EMA technical analysis, forecast prediction, by indicators ADX,MACD,RSI,CCI NSE stock exchange
Daily price and charts and targets CeigallIndia Strong Daily Stock price targets for CeigallIndia CEIGALL are 251.95 and 255.35 | Daily Target 1 | 251.08 | | Daily Target 2 | 252.82 | | Daily Target 3 | 254.48333333333 | | Daily Target 4 | 256.22 | | Daily Target 5 | 257.88 |
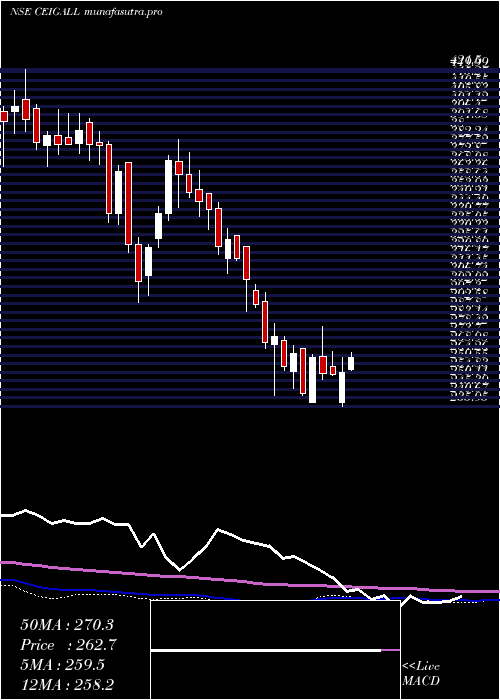
Daily price and volume Ceigall India
| Date |
Closing |
Open |
Range |
Volume |
Tue 28 October 2025 |
254.55 (0.26%) |
254.65 |
252.75 - 256.15 |
0.3166 times |
Mon 27 October 2025 |
253.90 (-0.29%) |
254.65 |
252.55 - 255.85 |
0.2752 times |
Fri 24 October 2025 |
254.65 (0.26%) |
255.20 |
253.10 - 257.50 |
0.4326 times |
Thu 23 October 2025 |
254.00 (-2.42%) |
258.70 |
252.50 - 261.00 |
0.8449 times |
Tue 21 October 2025 |
260.30 (-1.12%) |
260.40 |
258.25 - 263.00 |
0.2445 times |
Mon 20 October 2025 |
263.25 (6.15%) |
249.85 |
246.05 - 265.70 |
4.8229 times |
Fri 17 October 2025 |
248.00 (-1.29%) |
251.45 |
245.40 - 251.45 |
0.6341 times |
Thu 16 October 2025 |
251.25 (1.33%) |
249.45 |
247.95 - 252.95 |
0.4309 times |
Wed 15 October 2025 |
247.95 (-0.92%) |
251.90 |
247.00 - 251.90 |
0.7132 times |
Tue 14 October 2025 |
250.25 (-2.61%) |
256.90 |
249.35 - 257.90 |
1.2849 times |
Mon 13 October 2025 |
256.95 (-1.8%) |
260.70 |
256.00 - 260.70 |
0.5666 times |

Weekly price and charts CeigallIndia Strong weekly Stock price targets for CeigallIndia CEIGALL are 251.75 and 255.35 | Weekly Target 1 | 250.82 | | Weekly Target 2 | 252.68 | | Weekly Target 3 | 254.41666666667 | | Weekly Target 4 | 256.28 | | Weekly Target 5 | 258.02 |
Weekly price and volumes for Ceigall India
| Date |
Closing |
Open |
Range |
Volume |
Tue 28 October 2025 |
254.55 (-0.04%) |
254.65 |
252.55 - 256.15 |
0.0961 times |
Fri 24 October 2025 |
254.65 (2.68%) |
249.85 |
246.05 - 265.70 |
1.0303 times |
Fri 17 October 2025 |
248.00 (-5.22%) |
260.70 |
245.40 - 260.70 |
0.5894 times |
Fri 10 October 2025 |
261.65 (0.4%) |
270.95 |
259.50 - 273.00 |
0.9464 times |
Fri 03 October 2025 |
260.60 (-0.59%) |
268.40 |
260.00 - 269.90 |
0.6798 times |
Fri 26 September 2025 |
262.15 (-5.01%) |
283.89 |
260.01 - 284.21 |
1.5284 times |
Fri 19 September 2025 |
275.99 (2.45%) |
278.00 |
272.25 - 285.00 |
1.2768 times |
Fri 12 September 2025 |
269.39 (-1.71%) |
280.00 |
268.01 - 286.83 |
1.3789 times |
Fri 05 September 2025 |
274.09 (11.76%) |
245.24 |
244.16 - 276.00 |
2.0534 times |
Fri 29 August 2025 |
245.24 (-2.84%) |
253.00 |
243.27 - 255.00 |
0.4205 times |
Fri 22 August 2025 |
252.41 (2.64%) |
245.91 |
245.60 - 261.05 |
0.4536 times |
Monthly price and charts CeigallIndia Strong monthly Stock price targets for CeigallIndia CEIGALL are 236.18 and 263.78 | Monthly Target 1 | 230.05 | | Monthly Target 2 | 242.3 | | Monthly Target 3 | 257.65 | | Monthly Target 4 | 269.9 | | Monthly Target 5 | 285.25 |
Monthly price and volumes Ceigall India
| Date |
Closing |
Open |
Range |
Volume |
Tue 28 October 2025 |
254.55 (-2.8%) |
267.50 |
245.40 - 273.00 |
0.7798 times |
Tue 30 September 2025 |
261.89 (6.79%) |
245.24 |
244.16 - 286.83 |
1.7358 times |
Fri 29 August 2025 |
245.24 (-1.79%) |
249.95 |
243.00 - 273.00 |
0.7737 times |
Thu 31 July 2025 |
249.70 (-1.41%) |
254.50 |
248.20 - 291.00 |
2.9588 times |
Mon 30 June 2025 |
253.26 (1.36%) |
251.99 |
236.35 - 267.00 |
0.8933 times |
Fri 30 May 2025 |
249.85 (-1.87%) |
251.25 |
243.35 - 275.60 |
0.4897 times |
Wed 30 April 2025 |
254.60 (0.1%) |
257.90 |
235.95 - 270.95 |
0.4369 times |
Fri 28 March 2025 |
254.35 (-1.34%) |
255.10 |
238.35 - 279.90 |
0.903 times |
Fri 28 February 2025 |
257.80 (-15.67%) |
300.00 |
241.85 - 302.95 |
0.5035 times |
Fri 31 January 2025 |
305.70 (-10.04%) |
340.00 |
288.05 - 351.00 |
0.5256 times |
Tue 31 December 2024 |
339.80 (-0.7%) |
342.20 |
333.40 - 383.00 |
1.4755 times |

DMA SMA EMA moving averages of Ceigall India CEIGALL
DMA (daily moving average) of Ceigall India CEIGALL
| DMA period | DMA value | | 5 day DMA | 255.48 | | 12 day DMA | 254.73 | | 20 day DMA | 258.04 | | 35 day DMA | 264.66 | | 50 day DMA | 261.16 | | 100 day DMA | 260.64 | | 150 day DMA | 259.48 | | 200 day DMA | 266.26 | EMA (exponential moving average) of Ceigall India CEIGALL
| EMA period | EMA current | EMA prev | EMA prev2 | | 5 day EMA | 254.86 | 255.01 | 255.56 | | 12 day EMA | 256.17 | 256.46 | 256.92 | | 20 day EMA | 257.93 | 258.29 | 258.75 | | 35 day EMA | 258.35 | 258.57 | 258.85 | | 50 day EMA | 259.67 | 259.88 | 260.12 |
SMA (simple moving average) of Ceigall India CEIGALL
| SMA period | SMA current | SMA prev | SMA prev2 | | 5 day SMA | 255.48 | 257.22 | 256.04 | | 12 day SMA | 254.73 | 255.25 | 255.93 | | 20 day SMA | 258.04 | 258.42 | 259.29 | | 35 day SMA | 264.66 | 265.22 | 265.52 | | 50 day SMA | 261.16 | 260.98 | 260.82 | | 100 day SMA | 260.64 | 260.56 | 260.52 | | 150 day SMA | 259.48 | 259.48 | 259.4 | | 200 day SMA | 266.26 | 266.68 | 267.13 |
|
|
