CedaarTextile CEDAAR_SM full analysis,charts,indicators,moving averages,SMA,DMA,EMA,ADX,MACD,RSICedaar Textile CEDAAR_SM WideScreen charts, DMA,SMA,EMA technical analysis, forecast prediction, by indicators ADX,MACD,RSI,CCI NSE stock exchange
Daily price and charts and targets CedaarTextile Strong Daily Stock price targets for CedaarTextile CEDAAR_SM are 89.75 and 95.75 | Daily Target 1 | 88.5 | | Daily Target 2 | 91 | | Daily Target 3 | 94.5 | | Daily Target 4 | 97 | | Daily Target 5 | 100.5 |
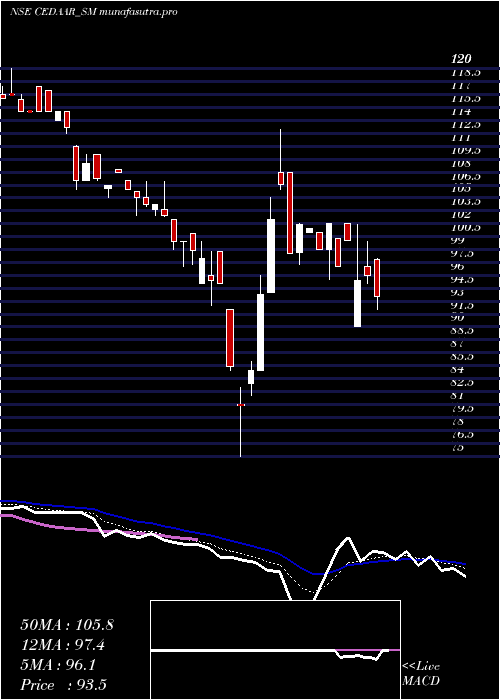
Daily price and volume Cedaar Textile
| Date |
Closing |
Open |
Range |
Volume |
Tue 28 October 2025 |
93.50 (-2.6%) |
97.90 |
92.00 - 98.00 |
0.5208 times |
Mon 27 October 2025 |
96.00 (0.68%) |
97.00 |
95.00 - 99.90 |
2.4306 times |
Fri 24 October 2025 |
95.35 (-4.65%) |
90.00 |
90.00 - 101.95 |
0.1736 times |
Thu 23 October 2025 |
100.00 (3.09%) |
102.00 |
100.00 - 102.00 |
1.7361 times |
Mon 20 October 2025 |
97.00 (-4.9%) |
100.30 |
97.00 - 100.30 |
0.1042 times |
Thu 16 October 2025 |
102.00 (3.03%) |
99.00 |
95.50 - 102.00 |
0.1389 times |
Wed 15 October 2025 |
99.00 (-2.46%) |
101.00 |
99.00 - 101.00 |
1.7361 times |
Tue 14 October 2025 |
101.50 (-0.44%) |
101.00 |
101.00 - 101.50 |
1.7361 times |
Mon 13 October 2025 |
101.95 (3.45%) |
98.60 |
97.30 - 102.00 |
1.1458 times |
Fri 10 October 2025 |
98.55 (-7.51%) |
108.00 |
98.55 - 108.00 |
0.2778 times |
Thu 09 October 2025 |
106.55 (3.95%) |
108.00 |
105.95 - 113.00 |
0.8681 times |
Weekly price and charts CedaarTextile Strong weekly Stock price targets for CedaarTextile CEDAAR_SM are 88.8 and 96.7 | Weekly Target 1 | 87.23 | | Weekly Target 2 | 90.37 | | Weekly Target 3 | 95.133333333333 | | Weekly Target 4 | 98.27 | | Weekly Target 5 | 103.03 |
Weekly price and volumes for Cedaar Textile
| Date |
Closing |
Open |
Range |
Volume |
Tue 28 October 2025 |
93.50 (-1.94%) |
97.00 |
92.00 - 99.90 |
0.6513 times |
Fri 24 October 2025 |
95.35 (-6.52%) |
100.30 |
90.00 - 102.00 |
0.4444 times |
Thu 16 October 2025 |
102.00 (3.5%) |
98.60 |
95.50 - 102.00 |
1.0498 times |
Fri 10 October 2025 |
98.55 (21.82%) |
83.45 |
82.00 - 113.00 |
1.1264 times |
Fri 03 October 2025 |
80.90 (-17.41%) |
96.00 |
75.00 - 98.75 |
1.433 times |
Fri 26 September 2025 |
97.95 (-6%) |
103.70 |
95.10 - 106.90 |
0.5134 times |
Fri 19 September 2025 |
104.20 (-2.16%) |
108.35 |
103.00 - 108.35 |
0.3448 times |
Fri 12 September 2025 |
106.50 (-7.39%) |
115.00 |
105.00 - 115.00 |
3.8238 times |
Fri 05 September 2025 |
115.00 (-1.71%) |
116.45 |
114.00 - 118.00 |
0.2375 times |
Fri 29 August 2025 |
117.00 (-1.68%) |
118.50 |
115.30 - 120.00 |
0.3755 times |
Fri 22 August 2025 |
119.00 (0.21%) |
118.15 |
117.55 - 122.00 |
0.3985 times |

Monthly price and charts CedaarTextile Strong monthly Stock price targets for CedaarTextile CEDAAR_SM are 84.25 and 122.25 | Monthly Target 1 | 55.83 | | Monthly Target 2 | 74.67 | | Monthly Target 3 | 93.833333333333 | | Monthly Target 4 | 112.67 | | Monthly Target 5 | 131.83 |
Monthly price and volumes Cedaar Textile
| Date |
Closing |
Open |
Range |
Volume |
Tue 28 October 2025 |
93.50 (-1.58%) |
92.00 |
75.00 - 113.00 |
1.1626 times |
Tue 30 September 2025 |
95.00 (-18.8%) |
116.45 |
92.55 - 118.00 |
1.2833 times |
Fri 29 August 2025 |
117.00 (-3.31%) |
120.55 |
111.00 - 124.00 |
0.8023 times |
Thu 31 July 2025 |
121.00 (0%) |
129.05 |
118.00 - 129.95 |
0.7517 times |
Tue 28 October 2025 |
(0%) |
|
- |
0 times |

DMA SMA EMA moving averages of Cedaar Textile CEDAAR_SM
DMA (daily moving average) of Cedaar Textile CEDAAR_SM
| DMA period | DMA value | | 5 day DMA | 96.37 | | 12 day DMA | 99.49 | | 20 day DMA | 96.31 | | 35 day DMA | 100.84 | | 50 day DMA | 105.91 | | 100 day DMA | | | 150 day DMA | | | 200 day DMA | | EMA (exponential moving average) of Cedaar Textile CEDAAR_SM
| EMA period | EMA current | EMA prev | EMA prev2 | | 5 day EMA | 96.13 | 97.44 | 98.16 | | 12 day EMA | 97.37 | 98.07 | 98.45 | | 20 day EMA | 98.48 | 99 | 99.32 | | 35 day EMA | 102.03 | 102.53 | 102.91 | | 50 day EMA | 106 | 106.51 | 106.94 |
SMA (simple moving average) of Cedaar Textile CEDAAR_SM
| SMA period | SMA current | SMA prev | SMA prev2 | | 5 day SMA | 96.37 | 98.07 | 98.67 | | 12 day SMA | 99.49 | 99.52 | 98.6 | | 20 day SMA | 96.31 | 96.63 | 96.83 | | 35 day SMA | 100.84 | 101.46 | 102 | | 50 day SMA | 105.91 | 106.37 | 106.81 | | 100 day SMA | | 150 day SMA | | 200 day SMA |
|
|
