CastrolIndia CASTROLIND full analysis,charts,indicators,moving averages,SMA,DMA,EMA,ADX,MACD,RSICastrol India CASTROLIND WideScreen charts, DMA,SMA,EMA technical analysis, forecast prediction, by indicators ADX,MACD,RSI,CCI NSE stock exchange
operates under Oil Marketing & Distribution sector
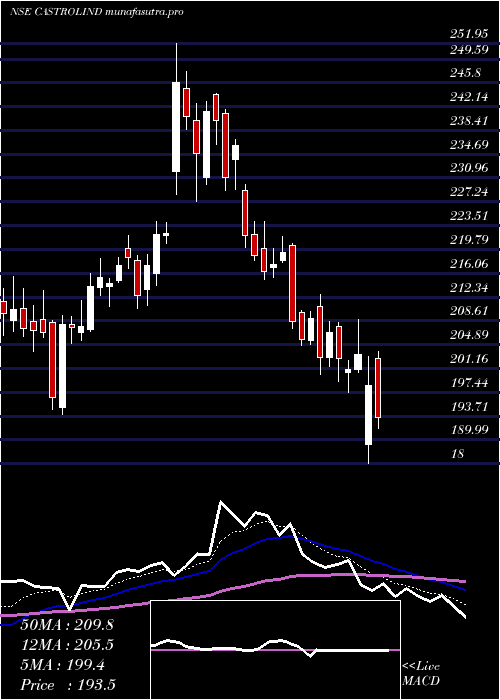
Daily price and charts and targets CastrolIndia Strong Daily Stock price targets for CastrolIndia CASTROLIND are 197.12 and 198.67 | Daily Target 1 | 196.8 | | Daily Target 2 | 197.43 | | Daily Target 3 | 198.34666666667 | | Daily Target 4 | 198.98 | | Daily Target 5 | 199.9 |
Daily price and volume Castrol India
| Date |
Closing |
Open |
Range |
Volume |
Tue 28 October 2025 |
198.07 (0.19%) |
198.68 |
197.71 - 199.26 |
0.6488 times |
Mon 27 October 2025 |
197.69 (-0.9%) |
200.80 |
197.32 - 200.80 |
0.9876 times |
Fri 24 October 2025 |
199.49 (-0.4%) |
200.30 |
198.66 - 200.63 |
0.7555 times |
Thu 23 October 2025 |
200.30 (-0.08%) |
201.38 |
199.55 - 201.39 |
0.5259 times |
Tue 21 October 2025 |
200.46 (0.2%) |
200.20 |
200.20 - 201.60 |
0.1953 times |
Mon 20 October 2025 |
200.06 (0.55%) |
200.00 |
198.51 - 201.02 |
0.8115 times |
Fri 17 October 2025 |
198.96 (-0.48%) |
200.00 |
197.80 - 200.40 |
0.9359 times |
Thu 16 October 2025 |
199.91 (-1.96%) |
205.00 |
199.70 - 205.29 |
1.302 times |
Wed 15 October 2025 |
203.90 (2.7%) |
199.00 |
198.81 - 207.20 |
3.1181 times |
Tue 14 October 2025 |
198.53 (-0.73%) |
200.00 |
198.02 - 200.64 |
0.7194 times |
Mon 13 October 2025 |
199.99 (-0.26%) |
199.90 |
199.12 - 201.29 |
0.8662 times |
Weekly price and charts CastrolIndia Strong weekly Stock price targets for CastrolIndia CASTROLIND are 195.96 and 199.44 | Weekly Target 1 | 195.25 | | Weekly Target 2 | 196.66 | | Weekly Target 3 | 198.73 | | Weekly Target 4 | 200.14 | | Weekly Target 5 | 202.21 |
Weekly price and volumes for Castrol India
| Date |
Closing |
Open |
Range |
Volume |
Tue 28 October 2025 |
198.07 (-0.71%) |
200.80 |
197.32 - 200.80 |
0.3125 times |
Fri 24 October 2025 |
199.49 (0.27%) |
200.00 |
198.51 - 201.60 |
0.437 times |
Fri 17 October 2025 |
198.96 (-0.77%) |
199.90 |
197.80 - 207.20 |
1.3257 times |
Fri 10 October 2025 |
200.51 (-1.06%) |
203.00 |
199.13 - 203.75 |
0.9328 times |
Fri 03 October 2025 |
202.65 (3.56%) |
196.00 |
195.10 - 203.10 |
0.8838 times |
Fri 26 September 2025 |
195.68 (-3.42%) |
202.70 |
195.41 - 205.33 |
0.9398 times |
Fri 19 September 2025 |
202.61 (2.67%) |
198.00 |
197.40 - 210.75 |
1.8361 times |
Fri 12 September 2025 |
197.34 (-0.22%) |
198.00 |
196.00 - 201.56 |
1.1403 times |
Fri 05 September 2025 |
197.77 (0.27%) |
197.40 |
196.55 - 202.20 |
1.2295 times |
Fri 29 August 2025 |
197.23 (-4.37%) |
206.25 |
196.68 - 210.25 |
0.9625 times |
Fri 22 August 2025 |
206.24 (0.47%) |
207.99 |
205.50 - 211.40 |
0.953 times |

Monthly price and charts CastrolIndia Strong monthly Stock price targets for CastrolIndia CASTROLIND are 192.76 and 202.64 | Monthly Target 1 | 190.98 | | Monthly Target 2 | 194.53 | | Monthly Target 3 | 200.86333333333 | | Monthly Target 4 | 204.41 | | Monthly Target 5 | 210.74 |
Monthly price and volumes Castrol India
| Date |
Closing |
Open |
Range |
Volume |
Tue 28 October 2025 |
198.07 (-0.79%) |
200.10 |
197.32 - 207.20 |
0.2374 times |
Tue 30 September 2025 |
199.64 (1.22%) |
197.40 |
195.10 - 210.75 |
0.3756 times |
Fri 29 August 2025 |
197.23 (-9.57%) |
218.94 |
196.68 - 224.80 |
0.3041 times |
Thu 31 July 2025 |
218.11 (-1.63%) |
222.11 |
216.76 - 232.43 |
0.8952 times |
Mon 30 June 2025 |
221.73 (2.55%) |
217.40 |
203.15 - 225.86 |
0.5883 times |
Fri 30 May 2025 |
216.22 (9.35%) |
197.55 |
193.14 - 220.39 |
0.8113 times |
Wed 30 April 2025 |
197.73 (-2.58%) |
202.80 |
186.26 - 211.15 |
1.1626 times |
Fri 28 March 2025 |
202.96 (-4.55%) |
213.50 |
200.20 - 251.95 |
2.4063 times |
Fri 28 February 2025 |
212.63 (19.87%) |
177.00 |
172.73 - 221.90 |
2.5327 times |
Fri 31 January 2025 |
177.38 (-10.15%) |
198.75 |
162.60 - 206.77 |
0.6865 times |
Tue 31 December 2024 |
197.42 (-1.65%) |
199.97 |
190.15 - 224.90 |
1.1876 times |
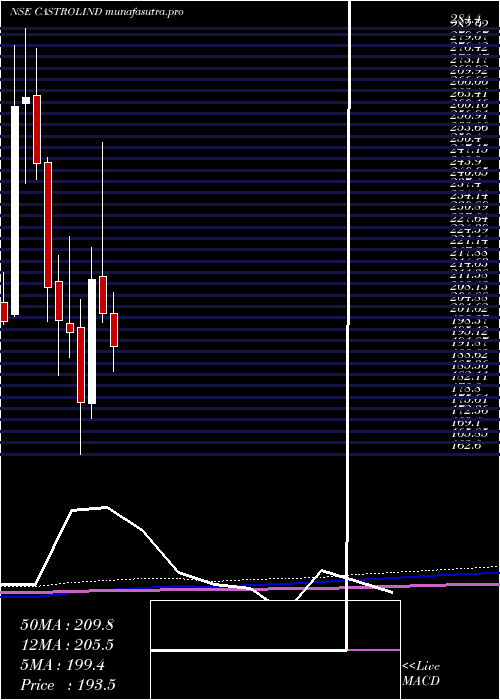
DMA SMA EMA moving averages of Castrol India CASTROLIND
DMA (daily moving average) of Castrol India CASTROLIND
| DMA period | DMA value | | 5 day DMA | 199.2 | | 12 day DMA | 199.82 | | 20 day DMA | 200.12 | | 35 day DMA | 200.32 | | 50 day DMA | 201.12 | | 100 day DMA | 209.5 | | 150 day DMA | 208.5 | | 200 day DMA | 207.18 | EMA (exponential moving average) of Castrol India CASTROLIND
| EMA period | EMA current | EMA prev | EMA prev2 | | 5 day EMA | 198.84 | 199.23 | 200 | | 12 day EMA | 199.58 | 199.86 | 200.26 | | 20 day EMA | 200.07 | 200.28 | 200.55 | | 35 day EMA | 200.98 | 201.15 | 201.35 | | 50 day EMA | 201.74 | 201.89 | 202.06 |
SMA (simple moving average) of Castrol India CASTROLIND
| SMA period | SMA current | SMA prev | SMA prev2 | | 5 day SMA | 199.2 | 199.6 | 199.85 | | 12 day SMA | 199.82 | 199.97 | 200.22 | | 20 day SMA | 200.12 | 200 | 200.13 | | 35 day SMA | 200.32 | 200.32 | 200.36 | | 50 day SMA | 201.12 | 201.32 | 201.56 | | 100 day SMA | 209.5 | 209.69 | 209.89 | | 150 day SMA | 208.5 | 208.63 | 208.8 | | 200 day SMA | 207.18 | 207.17 | 207.19 |
|
|
