IcicipramcCashietf CASHIETF full analysis,charts,indicators,moving averages,SMA,DMA,EMA,ADX,MACD,RSIIcicipramc Cashietf CASHIETF WideScreen charts, DMA,SMA,EMA technical analysis, forecast prediction, by indicators ADX,MACD,RSI,CCI NSE stock exchange
Daily price and charts and targets IcicipramcCashietf Strong Daily Stock price targets for IcicipramcCashietf CASHIETF are 1034.57 and 1034.59 | Daily Target 1 | 1034.57 | | Daily Target 2 | 1034.57 | | Daily Target 3 | 1034.5866666667 | | Daily Target 4 | 1034.59 | | Daily Target 5 | 1034.61 |
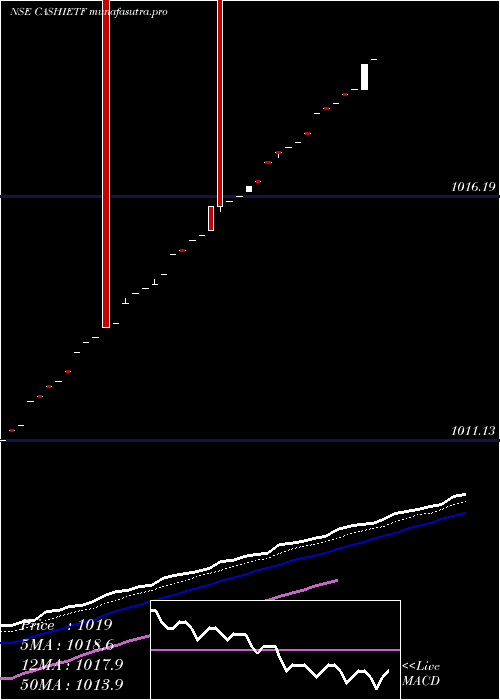
Daily price and volume Icicipramc Cashietf
| Date |
Closing |
Open |
Range |
Volume |
Thu 30 October 2025 |
1034.58 (0.01%) |
1034.58 |
1034.58 - 1034.60 |
1.3888 times |
Wed 29 October 2025 |
1034.44 (0.01%) |
1034.43 |
1034.43 - 1034.45 |
2.8621 times |
Tue 28 October 2025 |
1034.29 (0.01%) |
1034.30 |
1034.28 - 1034.30 |
0.3032 times |
Mon 27 October 2025 |
1034.15 (0.01%) |
1034.13 |
1034.13 - 1034.15 |
0.7008 times |
Fri 24 October 2025 |
1034.04 (0.05%) |
1064.57 |
1034.02 - 1064.57 |
2.1479 times |
Thu 23 October 2025 |
1033.56 (0.01%) |
1033.55 |
1033.55 - 1033.57 |
0.5729 times |
Tue 21 October 2025 |
1033.43 (0%) |
1033.43 |
1033.43 - 1033.43 |
0.0089 times |
Mon 20 October 2025 |
1033.43 (0.04%) |
1033.41 |
1033.41 - 1033.43 |
0.7383 times |
Fri 17 October 2025 |
1032.98 (0.04%) |
1033.51 |
1032.97 - 1033.51 |
0.9468 times |
Thu 16 October 2025 |
1032.52 (0.01%) |
1032.52 |
1032.52 - 1032.54 |
0.3302 times |
Wed 15 October 2025 |
1032.38 (0.01%) |
1032.39 |
1032.37 - 1032.39 |
0.5145 times |
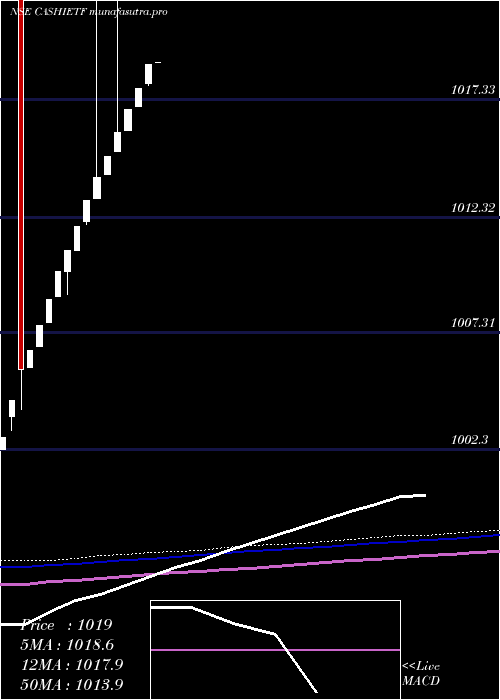
Weekly price and charts IcicipramcCashietf Strong weekly Stock price targets for IcicipramcCashietf CASHIETF are 1034.36 and 1034.83 | Weekly Target 1 | 1033.97 | | Weekly Target 2 | 1034.27 | | Weekly Target 3 | 1034.4366666667 | | Weekly Target 4 | 1034.74 | | Weekly Target 5 | 1034.91 |
Weekly price and volumes for Icicipramc Cashietf
| Date |
Closing |
Open |
Range |
Volume |
Thu 30 October 2025 |
1034.58 (0.05%) |
1034.13 |
1034.13 - 1034.60 |
0.6662 times |
Fri 24 October 2025 |
1034.04 (0.1%) |
1033.41 |
1033.41 - 1064.57 |
0.4397 times |
Fri 17 October 2025 |
1032.98 (0.1%) |
1032.11 |
1031.04 - 1033.51 |
2.0394 times |
Fri 10 October 2025 |
1031.95 (0.1%) |
1031.07 |
1031.00 - 1031.97 |
0.9249 times |
Fri 03 October 2025 |
1030.96 (0.1%) |
1035.00 |
1030.06 - 1035.08 |
1.1479 times |
Fri 26 September 2025 |
1029.94 (0.1%) |
1029.05 |
1029.03 - 1029.95 |
1.3907 times |
Fri 19 September 2025 |
1028.90 (0.1%) |
1028.03 |
1028.01 - 1028.92 |
0.8624 times |
Fri 12 September 2025 |
1027.88 (0.08%) |
1027.05 |
1027.04 - 1027.90 |
0.8725 times |
Fri 05 September 2025 |
1027.04 (0.11%) |
1032.00 |
1026.02 - 1032.00 |
0.9943 times |
Fri 29 August 2025 |
1025.90 (0.1%) |
1025.01 |
1025.01 - 1025.91 |
0.6619 times |
Fri 22 August 2025 |
1024.89 (0.1%) |
1023.86 |
1023.86 - 1030.52 |
0.3543 times |
Monthly price and charts IcicipramcCashietf Strong monthly Stock price targets for IcicipramcCashietf CASHIETF are 1032.54 and 1066.61 | Monthly Target 1 | 1009.15 | | Monthly Target 2 | 1021.86 | | Monthly Target 3 | 1043.2166666667 | | Monthly Target 4 | 1055.93 | | Monthly Target 5 | 1077.29 |
Monthly price and volumes Icicipramc Cashietf
| Date |
Closing |
Open |
Range |
Volume |
Thu 30 October 2025 |
1034.58 (0.42%) |
1030.50 |
1030.50 - 1064.57 |
1.6434 times |
Tue 30 September 2025 |
1030.22 (0.42%) |
1032.00 |
1026.02 - 1035.08 |
1.4886 times |
Fri 29 August 2025 |
1025.90 (0.44%) |
1021.87 |
1001.71 - 1030.52 |
0.8301 times |
Thu 31 July 2025 |
1021.43 (0.43%) |
1017.18 |
1017.18 - 1045.35 |
1.2962 times |
Mon 30 June 2025 |
1017.05 (0.4%) |
1013.10 |
1013.10 - 1033.52 |
1.8711 times |
Fri 30 May 2025 |
1012.98 (0.47%) |
1008.74 |
1008.72 - 1012.98 |
0.5641 times |
Wed 30 April 2025 |
1008.26 (0.55%) |
1003.72 |
1003.14 - 1034.60 |
0.2847 times |
Thu 27 March 2025 |
1002.78 (0%) |
1001.47 |
1001.47 - 1002.80 |
0.0218 times |
Thu 30 October 2025 |
(0%) |
|
- |
0 times |

DMA SMA EMA moving averages of Icicipramc Cashietf CASHIETF
DMA (daily moving average) of Icicipramc Cashietf CASHIETF
| DMA period | DMA value | | 5 day DMA | 1034.3 | | 12 day DMA | 1033.5 | | 20 day DMA | 1032.64 | | 35 day DMA | 1030.98 | | 50 day DMA | 1029.41 | | 100 day DMA | 1024.15 | | 150 day DMA | 1018.89 | | 200 day DMA | | EMA (exponential moving average) of Icicipramc Cashietf CASHIETF
| EMA period | EMA current | EMA prev | EMA prev2 | | 5 day EMA | 1034.25 | 1034.08 | 1033.9 | | 12 day EMA | 1033.51 | 1033.31 | 1033.1 | | 20 day EMA | 1032.63 | 1032.43 | 1032.22 | | 35 day EMA | 1031.03 | 1030.82 | 1030.61 | | 50 day EMA | 1029.41 | 1029.2 | 1028.99 |
SMA (simple moving average) of Icicipramc Cashietf CASHIETF
| SMA period | SMA current | SMA prev | SMA prev2 | | 5 day SMA | 1034.3 | 1034.1 | 1033.89 | | 12 day SMA | 1033.5 | 1033.3 | 1033.09 | | 20 day SMA | 1032.64 | 1032.42 | 1032.2 | | 35 day SMA | 1030.98 | 1030.77 | 1030.56 | | 50 day SMA | 1029.41 | 1029.2 | 1028.99 | | 100 day SMA | 1024.15 | 1023.94 | 1023.73 | | 150 day SMA | 1018.89 | | 200 day SMA |
|
|
