CapaciteInfraproject CAPACITE full analysis,charts,indicators,moving averages,SMA,DMA,EMA,ADX,MACD,RSICapacite Infraproject CAPACITE WideScreen charts, DMA,SMA,EMA technical analysis, forecast prediction, by indicators ADX,MACD,RSI,CCI NSE stock exchange
Daily price and charts and targets CapaciteInfraproject Strong Daily Stock price targets for CapaciteInfraproject CAPACITE are 273.28 and 281.38 | Daily Target 1 | 266.82 | | Daily Target 2 | 271.63 | | Daily Target 3 | 274.91666666667 | | Daily Target 4 | 279.73 | | Daily Target 5 | 283.02 |
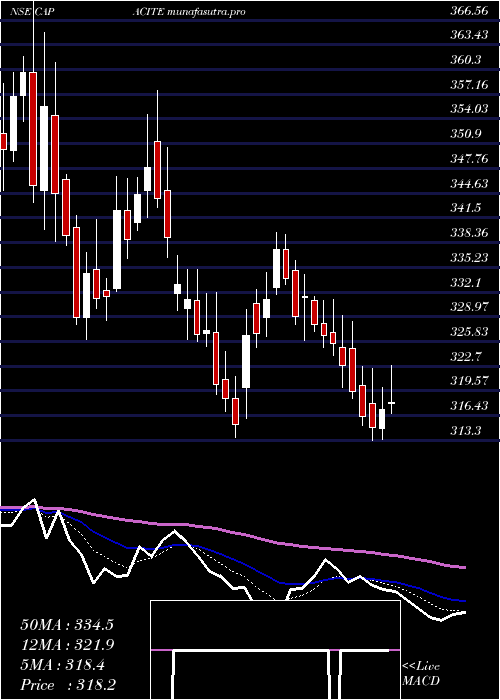
Daily price and volume Capacite Infraproject
| Date |
Closing |
Open |
Range |
Volume |
Tue 28 October 2025 |
276.45 (2.01%) |
271.85 |
270.10 - 278.20 |
1.0539 times |
Mon 27 October 2025 |
271.00 (-0.62%) |
275.00 |
269.10 - 275.70 |
1.0164 times |
Fri 24 October 2025 |
272.70 (-0.18%) |
273.00 |
270.55 - 278.40 |
0.6475 times |
Thu 23 October 2025 |
273.20 (-1.1%) |
274.80 |
267.10 - 276.70 |
1.7745 times |
Tue 21 October 2025 |
276.25 (0.86%) |
273.50 |
273.45 - 277.65 |
0.3205 times |
Mon 20 October 2025 |
273.90 (0.72%) |
272.10 |
265.10 - 276.60 |
1.4794 times |
Fri 17 October 2025 |
271.95 (-1.86%) |
275.40 |
270.35 - 279.05 |
1.7036 times |
Thu 16 October 2025 |
277.10 (-0.41%) |
278.95 |
276.00 - 281.65 |
0.5717 times |
Wed 15 October 2025 |
278.25 (0.69%) |
276.00 |
275.85 - 279.55 |
0.3191 times |
Tue 14 October 2025 |
276.35 (-2.3%) |
282.95 |
275.55 - 283.70 |
1.1134 times |
Mon 13 October 2025 |
282.85 (-1.24%) |
285.00 |
280.80 - 285.50 |
1.014 times |
Weekly price and charts CapaciteInfraproject Strong weekly Stock price targets for CapaciteInfraproject CAPACITE are 272.78 and 281.88 | Weekly Target 1 | 265.48 | | Weekly Target 2 | 270.97 | | Weekly Target 3 | 274.58333333333 | | Weekly Target 4 | 280.07 | | Weekly Target 5 | 283.68 |
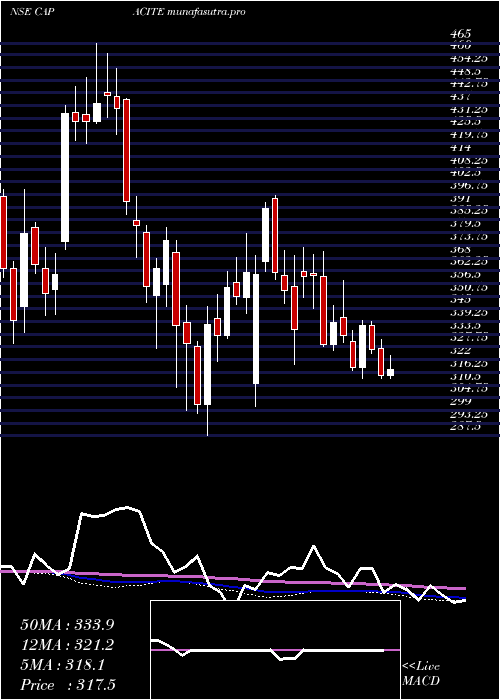
Weekly price and volumes for Capacite Infraproject
| Date |
Closing |
Open |
Range |
Volume |
Tue 28 October 2025 |
276.45 (1.38%) |
275.00 |
269.10 - 278.20 |
0.2997 times |
Fri 24 October 2025 |
272.70 (0.28%) |
272.10 |
265.10 - 278.40 |
0.6112 times |
Fri 17 October 2025 |
271.95 (-5.05%) |
285.00 |
270.35 - 285.50 |
0.6835 times |
Fri 10 October 2025 |
286.40 (-0.35%) |
288.00 |
270.10 - 288.40 |
1.093 times |
Fri 03 October 2025 |
287.40 (-0.85%) |
290.05 |
280.00 - 294.50 |
0.9102 times |
Fri 26 September 2025 |
289.85 (-7.17%) |
310.85 |
288.80 - 319.00 |
1.009 times |
Fri 19 September 2025 |
312.25 (4.05%) |
301.40 |
298.05 - 334.00 |
2.5997 times |
Fri 12 September 2025 |
300.10 (1.2%) |
296.70 |
293.35 - 313.95 |
1.4622 times |
Fri 05 September 2025 |
296.55 (5.2%) |
282.00 |
282.00 - 309.00 |
0.7344 times |
Fri 29 August 2025 |
281.90 (-5.89%) |
300.00 |
280.20 - 305.50 |
0.5972 times |
Fri 22 August 2025 |
299.55 (8.2%) |
279.70 |
277.00 - 305.30 |
1.0617 times |
Monthly price and charts CapaciteInfraproject Strong monthly Stock price targets for CapaciteInfraproject CAPACITE are 257 and 284.55 | Monthly Target 1 | 250.52 | | Monthly Target 2 | 263.48 | | Monthly Target 3 | 278.06666666667 | | Monthly Target 4 | 291.03 | | Monthly Target 5 | 305.62 |
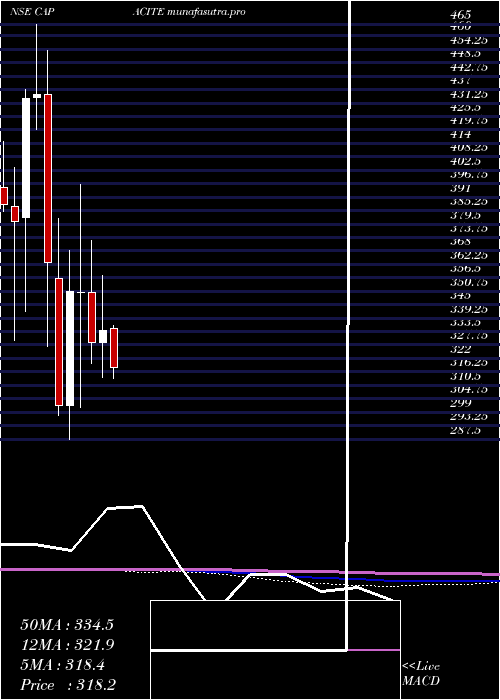
Monthly price and volumes Capacite Infraproject
| Date |
Closing |
Open |
Range |
Volume |
Tue 28 October 2025 |
276.45 (-4.38%) |
292.00 |
265.10 - 292.65 |
0.5254 times |
Tue 30 September 2025 |
289.10 (2.55%) |
282.00 |
280.00 - 334.00 |
1.0349 times |
Fri 29 August 2025 |
281.90 (-8.07%) |
306.65 |
276.00 - 308.75 |
0.5533 times |
Thu 31 July 2025 |
306.65 (-8.13%) |
334.80 |
295.30 - 338.65 |
0.7016 times |
Mon 30 June 2025 |
333.80 (1.51%) |
328.85 |
313.70 - 357.65 |
0.811 times |
Fri 30 May 2025 |
328.85 (-6.07%) |
350.00 |
320.00 - 372.60 |
1.2974 times |
Wed 30 April 2025 |
350.10 (-0.11%) |
350.00 |
301.00 - 396.45 |
0.8817 times |
Fri 28 March 2025 |
350.50 (16.14%) |
301.80 |
287.50 - 368.10 |
1.1505 times |
Fri 28 February 2025 |
301.80 (-16.92%) |
356.10 |
297.50 - 381.80 |
1.731 times |
Fri 31 January 2025 |
363.25 (-16.49%) |
434.95 |
327.10 - 453.80 |
1.3133 times |
Tue 31 December 2024 |
435.00 (0.39%) |
433.70 |
420.00 - 465.00 |
1.8555 times |
DMA SMA EMA moving averages of Capacite Infraproject CAPACITE
DMA (daily moving average) of Capacite Infraproject CAPACITE
| DMA period | DMA value | | 5 day DMA | 273.92 | | 12 day DMA | 276.37 | | 20 day DMA | 278.57 | | 35 day DMA | 290.02 | | 50 day DMA | 290.98 | | 100 day DMA | 305.48 | | 150 day DMA | 322.37 | | 200 day DMA | 329.66 | EMA (exponential moving average) of Capacite Infraproject CAPACITE
| EMA period | EMA current | EMA prev | EMA prev2 | | 5 day EMA | 274.24 | 273.13 | 274.2 | | 12 day EMA | 276.42 | 276.42 | 277.41 | | 20 day EMA | 279.86 | 280.22 | 281.19 | | 35 day EMA | 283.77 | 284.2 | 284.98 | | 50 day EMA | 289.02 | 289.53 | 290.29 |
SMA (simple moving average) of Capacite Infraproject CAPACITE
| SMA period | SMA current | SMA prev | SMA prev2 | | 5 day SMA | 273.92 | 273.41 | 273.6 | | 12 day SMA | 276.37 | 276.55 | 276.58 | | 20 day SMA | 278.57 | 279.24 | 280.6 | | 35 day SMA | 290.02 | 290.6 | 291.39 | | 50 day SMA | 290.98 | 291.12 | 291.36 | | 100 day SMA | 305.48 | 306.03 | 306.63 | | 150 day SMA | 322.37 | 322.87 | 323.33 | | 200 day SMA | 329.66 | 330.33 | 331.15 |
|
|
