CanFin CANFINHOME full analysis,charts,indicators,moving averages,SMA,DMA,EMA,ADX,MACD,RSICan Fin CANFINHOME WideScreen charts, DMA,SMA,EMA technical analysis, forecast prediction, by indicators ADX,MACD,RSI,CCI NSE stock exchange
operates under Housing Finance sector
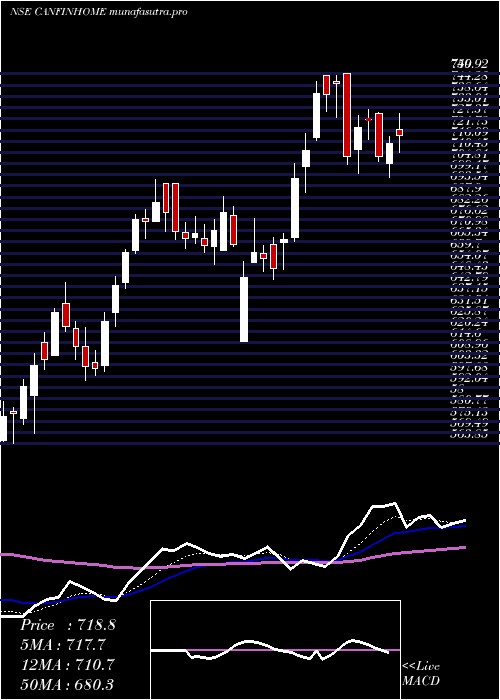
Daily price and charts and targets CanFin Strong Daily Stock price targets for CanFin CANFINHOME are 848.78 and 866.28 | Daily Target 1 | 844.08 | | Daily Target 2 | 853.47 | | Daily Target 3 | 861.58333333333 | | Daily Target 4 | 870.97 | | Daily Target 5 | 879.08 |
Daily price and volume Can Fin
| Date |
Closing |
Open |
Range |
Volume |
Wed 29 October 2025 |
862.85 (-0.25%) |
869.70 |
852.20 - 869.70 |
0.8801 times |
Tue 28 October 2025 |
865.00 (1.09%) |
859.40 |
857.50 - 867.95 |
0.6417 times |
Mon 27 October 2025 |
855.70 (0.88%) |
853.70 |
843.85 - 857.95 |
0.3002 times |
Fri 24 October 2025 |
848.25 (-0.6%) |
860.65 |
838.15 - 860.70 |
0.7553 times |
Thu 23 October 2025 |
853.35 (1.06%) |
850.00 |
845.00 - 865.00 |
1.1994 times |
Tue 21 October 2025 |
844.40 (0.72%) |
845.05 |
831.00 - 859.85 |
0.5054 times |
Mon 20 October 2025 |
838.35 (4.66%) |
819.05 |
810.00 - 849.00 |
4.5976 times |
Fri 17 October 2025 |
801.05 (-0.44%) |
804.55 |
797.15 - 807.95 |
0.2429 times |
Thu 16 October 2025 |
804.55 (0.25%) |
802.50 |
795.15 - 806.15 |
0.4664 times |
Wed 15 October 2025 |
802.55 (2.24%) |
787.00 |
783.10 - 805.00 |
0.411 times |
Tue 14 October 2025 |
785.00 (-2.04%) |
796.00 |
780.05 - 807.30 |
0.5392 times |
Weekly price and charts CanFin Strong weekly Stock price targets for CanFin CANFINHOME are 853.35 and 879.2 | Weekly Target 1 | 832.95 | | Weekly Target 2 | 847.9 | | Weekly Target 3 | 858.8 | | Weekly Target 4 | 873.75 | | Weekly Target 5 | 884.65 |
Weekly price and volumes for Can Fin
| Date |
Closing |
Open |
Range |
Volume |
Wed 29 October 2025 |
862.85 (1.72%) |
853.70 |
843.85 - 869.70 |
0.6455 times |
Fri 24 October 2025 |
848.25 (5.89%) |
819.05 |
810.00 - 865.00 |
2.5003 times |
Fri 17 October 2025 |
801.05 (0.94%) |
786.85 |
780.05 - 807.95 |
0.8272 times |
Fri 10 October 2025 |
793.60 (0.5%) |
785.00 |
781.00 - 810.25 |
1.0655 times |
Fri 03 October 2025 |
789.65 (6.19%) |
744.50 |
740.30 - 796.00 |
1.5643 times |
Fri 26 September 2025 |
743.60 (-3.9%) |
770.00 |
738.30 - 791.95 |
0.7685 times |
Fri 19 September 2025 |
773.80 (3.68%) |
746.35 |
743.15 - 784.30 |
0.7976 times |
Fri 12 September 2025 |
746.35 (-1.09%) |
751.05 |
733.00 - 757.05 |
0.4119 times |
Fri 05 September 2025 |
754.55 (5.14%) |
717.65 |
715.00 - 774.95 |
0.6851 times |
Fri 29 August 2025 |
717.65 (-6.77%) |
770.90 |
708.60 - 772.35 |
0.7342 times |
Fri 22 August 2025 |
769.75 (1.42%) |
766.00 |
755.45 - 789.90 |
1.3836 times |
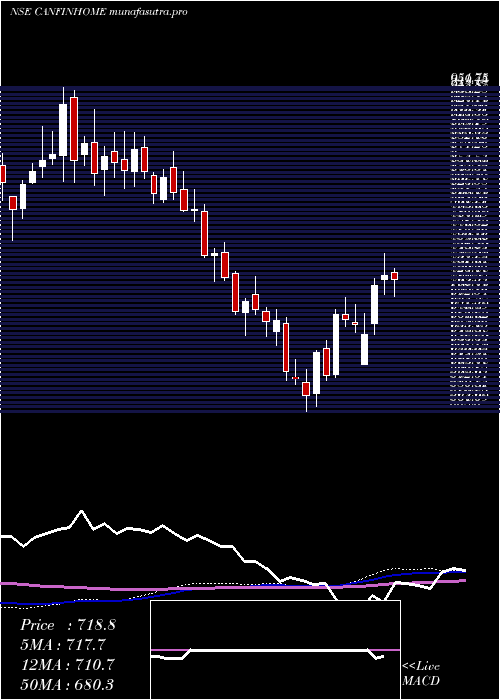
Monthly price and charts CanFin Strong monthly Stock price targets for CanFin CANFINHOME are 808.43 and 924.13 | Monthly Target 1 | 713.15 | | Monthly Target 2 | 788 | | Monthly Target 3 | 828.85 | | Monthly Target 4 | 903.7 | | Monthly Target 5 | 944.55 |
Monthly price and volumes Can Fin
| Date |
Closing |
Open |
Range |
Volume |
Wed 29 October 2025 |
862.85 (13.06%) |
763.65 |
754.00 - 869.70 |
0.8169 times |
Tue 30 September 2025 |
763.20 (6.35%) |
717.65 |
715.00 - 791.95 |
0.378 times |
Fri 29 August 2025 |
717.65 (-4.56%) |
751.95 |
708.60 - 789.90 |
0.4946 times |
Thu 31 July 2025 |
751.95 (-5.16%) |
793.20 |
727.50 - 826.65 |
0.7471 times |
Mon 30 June 2025 |
792.90 (0.6%) |
788.20 |
754.80 - 817.75 |
0.7485 times |
Fri 30 May 2025 |
788.15 (10.21%) |
722.00 |
691.55 - 790.80 |
0.7353 times |
Wed 30 April 2025 |
715.15 (6.83%) |
666.80 |
615.00 - 750.00 |
1.2358 times |
Fri 28 March 2025 |
669.45 (15.89%) |
580.05 |
563.85 - 696.75 |
0.9386 times |
Fri 28 February 2025 |
577.65 (-13.49%) |
655.00 |
558.50 - 682.00 |
1.5933 times |
Fri 31 January 2025 |
667.70 (-12.06%) |
752.05 |
648.85 - 758.00 |
2.3121 times |
Tue 31 December 2024 |
759.30 (-7.85%) |
828.00 |
716.70 - 849.85 |
2.162 times |
DMA SMA EMA moving averages of Can Fin CANFINHOME
DMA (daily moving average) of Can Fin CANFINHOME
| DMA period | DMA value | | 5 day DMA | 857.03 | | 12 day DMA | 830.2 | | 20 day DMA | 814.15 | | 35 day DMA | 791.38 | | 50 day DMA | 780.08 | | 100 day DMA | 781.94 | | 150 day DMA | 760.71 | | 200 day DMA | 730.87 | EMA (exponential moving average) of Can Fin CANFINHOME
| EMA period | EMA current | EMA prev | EMA prev2 | | 5 day EMA | 854.96 | 851.01 | 844.01 | | 12 day EMA | 835.86 | 830.96 | 824.77 | | 20 day EMA | 820.38 | 815.91 | 810.74 | | 35 day EMA | 801.93 | 798.34 | 794.42 | | 50 day EMA | 785.33 | 782.17 | 778.79 |
SMA (simple moving average) of Can Fin CANFINHOME
| SMA period | SMA current | SMA prev | SMA prev2 | | 5 day SMA | 857.03 | 853.34 | 848.01 | | 12 day SMA | 830.2 | 824.43 | 818.16 | | 20 day SMA | 814.15 | 808.55 | 802.48 | | 35 day SMA | 791.38 | 788.04 | 784.89 | | 50 day SMA | 780.08 | 778.01 | 775.74 | | 100 day SMA | 781.94 | 781.09 | 780.27 | | 150 day SMA | 760.71 | 759.47 | 758.1 | | 200 day SMA | 730.87 | 730.13 | 729.29 |
|
|
