BarakValley BVCL_BE full analysis,charts,indicators,moving averages,SMA,DMA,EMA,ADX,MACD,RSIBarak Valley BVCL_BE WideScreen charts, DMA,SMA,EMA technical analysis, forecast prediction, by indicators ADX,MACD,RSI,CCI NSE stock exchange
Daily price and charts and targets BarakValley Strong Daily Stock price targets for BarakValley BVCL_BE are 45.41 and 46.65 | Daily Target 1 | 45.11 | | Daily Target 2 | 45.71 | | Daily Target 3 | 46.35 | | Daily Target 4 | 46.95 | | Daily Target 5 | 47.59 |
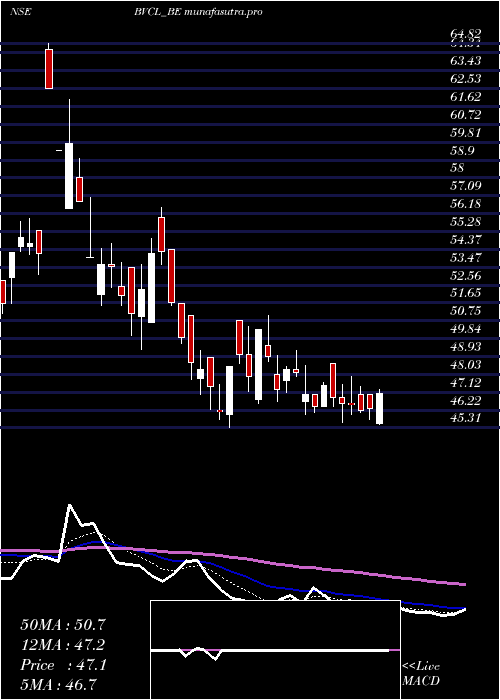
Daily price and volume Barak Valley
| Date |
Closing |
Open |
Range |
Volume |
Wed 29 October 2025 |
46.31 (0.28%) |
46.99 |
45.75 - 46.99 |
2.5758 times |
Tue 28 October 2025 |
46.18 (-0.69%) |
47.00 |
46.08 - 47.39 |
0.3794 times |
Mon 27 October 2025 |
46.50 (-0.11%) |
46.55 |
46.00 - 47.90 |
0.6796 times |
Fri 24 October 2025 |
46.55 (-0.6%) |
46.83 |
45.60 - 47.50 |
0.5916 times |
Thu 23 October 2025 |
46.83 (-1.31%) |
48.60 |
46.41 - 48.60 |
0.5827 times |
Tue 21 October 2025 |
47.45 (2.31%) |
46.38 |
46.38 - 47.60 |
0.3552 times |
Mon 20 October 2025 |
46.38 (-1.34%) |
47.00 |
46.10 - 47.01 |
0.5501 times |
Fri 17 October 2025 |
47.01 (-2.27%) |
46.65 |
46.01 - 48.50 |
1.7335 times |
Thu 16 October 2025 |
48.10 (-0.33%) |
48.26 |
47.90 - 49.25 |
1.307 times |
Wed 15 October 2025 |
48.26 (2.07%) |
47.70 |
47.11 - 48.45 |
1.2451 times |
Tue 14 October 2025 |
47.28 (-3.35%) |
48.00 |
46.65 - 49.00 |
0.8757 times |
Weekly price and charts BarakValley Strong weekly Stock price targets for BarakValley BVCL_BE are 44.96 and 47.11 | Weekly Target 1 | 44.5 | | Weekly Target 2 | 45.41 | | Weekly Target 3 | 46.653333333333 | | Weekly Target 4 | 47.56 | | Weekly Target 5 | 48.8 |
Weekly price and volumes for Barak Valley
| Date |
Closing |
Open |
Range |
Volume |
Wed 29 October 2025 |
46.31 (-0.52%) |
46.55 |
45.75 - 47.90 |
0.3324 times |
Fri 24 October 2025 |
46.55 (-0.98%) |
47.00 |
45.60 - 48.60 |
0.1902 times |
Fri 17 October 2025 |
47.01 (-6.58%) |
49.50 |
46.01 - 50.99 |
0.6138 times |
Fri 10 October 2025 |
50.32 (6.12%) |
46.20 |
45.31 - 50.78 |
1.0198 times |
Fri 03 October 2025 |
47.42 (-8.21%) |
51.63 |
46.25 - 51.63 |
0.8275 times |
Fri 26 September 2025 |
51.66 (-0.67%) |
53.47 |
49.31 - 56.51 |
1.697 times |
Fri 19 September 2025 |
52.01 (-12.98%) |
58.00 |
51.50 - 59.00 |
2.1336 times |
Fri 12 September 2025 |
59.77 (10.38%) |
64.50 |
56.43 - 64.82 |
2.3262 times |
Fri 17 May 2024 |
54.15 (2.56%) |
52.80 |
51.10 - 55.95 |
0.1489 times |
Fri 10 May 2024 |
52.80 (-8.81%) |
60.65 |
51.65 - 61.85 |
0.7107 times |
Fri 03 May 2024 |
57.90 (6.73%) |
54.25 |
54.25 - 57.90 |
0.2669 times |

Monthly price and charts BarakValley Strong monthly Stock price targets for BarakValley BVCL_BE are 42.97 and 48.65 | Monthly Target 1 | 41.86 | | Monthly Target 2 | 44.08 | | Monthly Target 3 | 47.536666666667 | | Monthly Target 4 | 49.76 | | Monthly Target 5 | 53.22 |
Monthly price and volumes Barak Valley
| Date |
Closing |
Open |
Range |
Volume |
Wed 29 October 2025 |
46.31 (-4.73%) |
47.80 |
45.31 - 50.99 |
0.7616 times |
Tue 30 September 2025 |
48.61 (-10.23%) |
64.50 |
47.75 - 64.82 |
1.9833 times |
Fri 17 May 2024 |
54.15 (-2.78%) |
56.80 |
51.10 - 61.85 |
0.3085 times |
Tue 30 April 2024 |
55.70 (1.64%) |
53.70 |
52.90 - 58.30 |
0.2017 times |
Thu 28 March 2024 |
54.80 (-9.05%) |
61.75 |
48.25 - 62.95 |
0.4049 times |
Thu 29 February 2024 |
60.25 (1.69%) |
62.00 |
58.05 - 77.00 |
1.3783 times |
Wed 31 January 2024 |
59.25 (15.5%) |
51.95 |
50.70 - 59.75 |
0.9679 times |
Fri 29 December 2023 |
51.30 (4.27%) |
50.40 |
45.05 - 59.25 |
1.4952 times |
Thu 30 November 2023 |
49.20 (30.5%) |
37.70 |
36.45 - 51.50 |
1.9266 times |
Tue 31 October 2023 |
37.70 (-3.95%) |
39.25 |
34.85 - 40.85 |
0.5718 times |
Fri 29 September 2023 |
39.25 (7.24%) |
36.10 |
35.55 - 42.80 |
0.8266 times |

DMA SMA EMA moving averages of Barak Valley BVCL_BE
DMA (daily moving average) of Barak Valley BVCL_BE
| DMA period | DMA value | | 5 day DMA | 46.47 | | 12 day DMA | 47.15 | | 20 day DMA | 47.6 | | 35 day DMA | 50.6 | | 50 day DMA | 52.03 | | 100 day DMA | 54.98 | | 150 day DMA | 54.93 | | 200 day DMA | 51.47 | EMA (exponential moving average) of Barak Valley BVCL_BE
| EMA period | EMA current | EMA prev | EMA prev2 | | 5 day EMA | 46.51 | 46.61 | 46.82 | | 12 day EMA | 47.18 | 47.34 | 47.55 | | 20 day EMA | 48.12 | 48.31 | 48.53 | | 35 day EMA | 49.77 | 49.97 | 50.19 | | 50 day EMA | 51.67 | 51.89 | 52.12 |
SMA (simple moving average) of Barak Valley BVCL_BE
| SMA period | SMA current | SMA prev | SMA prev2 | | 5 day SMA | 46.47 | 46.7 | 46.74 | | 12 day SMA | 47.15 | 47.48 | 47.63 | | 20 day SMA | 47.6 | 47.78 | 48.05 | | 35 day SMA | 50.6 | 50.84 | 51.09 | | 50 day SMA | 52.03 | 52.17 | 52.33 | | 100 day SMA | 54.98 | 55.28 | 55.55 | | 150 day SMA | 54.93 | 54.95 | 54.96 | | 200 day SMA | 51.47 | 51.42 | 51.38 |
|
|
