ButterflyGandhimathi BUTTERFLY full analysis,charts,indicators,moving averages,SMA,DMA,EMA,ADX,MACD,RSIButterfly Gandhimathi BUTTERFLY WideScreen charts, DMA,SMA,EMA technical analysis, forecast prediction, by indicators ADX,MACD,RSI,CCI NSE stock exchange
operates under Household Appliances sector
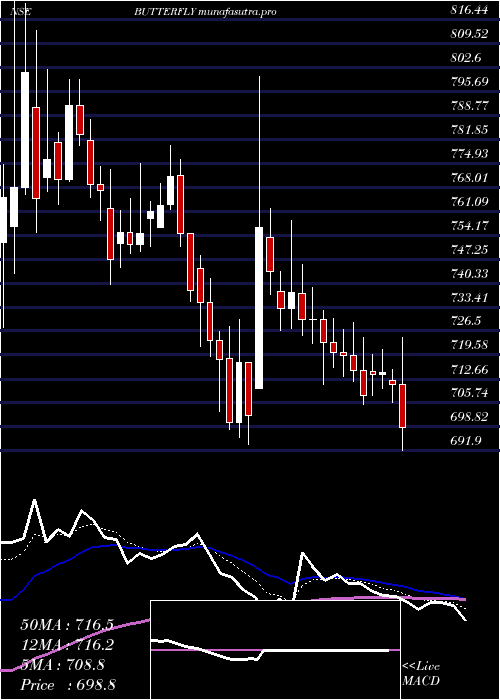
Daily price and charts and targets ButterflyGandhimathi Strong Daily Stock price targets for ButterflyGandhimathi BUTTERFLY are 711 and 740.4 | Daily Target 1 | 688.48 | | Daily Target 2 | 704.12 | | Daily Target 3 | 717.88333333333 | | Daily Target 4 | 733.52 | | Daily Target 5 | 747.28 |
Daily price and volume Butterfly Gandhimathi
| Date |
Closing |
Open |
Range |
Volume |
Tue 28 October 2025 |
719.75 (2.49%) |
702.30 |
702.25 - 731.65 |
3.6493 times |
Mon 27 October 2025 |
702.25 (0.21%) |
701.05 |
700.00 - 706.75 |
0.837 times |
Fri 24 October 2025 |
700.80 (0.08%) |
700.30 |
700.00 - 708.95 |
0.8197 times |
Thu 23 October 2025 |
700.25 (-1.59%) |
705.00 |
700.00 - 713.90 |
0.6141 times |
Tue 21 October 2025 |
711.55 (0.44%) |
705.10 |
705.00 - 717.20 |
0.2653 times |
Mon 20 October 2025 |
708.40 (0.72%) |
710.35 |
701.05 - 720.00 |
0.6793 times |
Fri 17 October 2025 |
703.35 (-0.27%) |
705.30 |
700.00 - 711.00 |
0.9951 times |
Thu 16 October 2025 |
705.25 (0.6%) |
701.10 |
700.00 - 710.00 |
0.3476 times |
Wed 15 October 2025 |
701.05 (0.1%) |
700.05 |
700.00 - 712.70 |
1.311 times |
Tue 14 October 2025 |
700.35 (-0.68%) |
714.55 |
700.00 - 714.55 |
0.4815 times |
Mon 13 October 2025 |
705.15 (-0.58%) |
709.25 |
700.00 - 715.00 |
0.7301 times |
Weekly price and charts ButterflyGandhimathi Strong weekly Stock price targets for ButterflyGandhimathi BUTTERFLY are 709.88 and 741.53 | Weekly Target 1 | 685.48 | | Weekly Target 2 | 702.62 | | Weekly Target 3 | 717.13333333333 | | Weekly Target 4 | 734.27 | | Weekly Target 5 | 748.78 |
Weekly price and volumes for Butterfly Gandhimathi
| Date |
Closing |
Open |
Range |
Volume |
Tue 28 October 2025 |
719.75 (2.7%) |
701.05 |
700.00 - 731.65 |
0.6641 times |
Fri 24 October 2025 |
700.80 (-0.36%) |
710.35 |
700.00 - 720.00 |
0.3521 times |
Fri 17 October 2025 |
703.35 (-0.83%) |
709.25 |
700.00 - 715.00 |
0.5722 times |
Fri 10 October 2025 |
709.25 (2.15%) |
694.40 |
685.10 - 715.00 |
0.7689 times |
Fri 03 October 2025 |
694.35 (-0.14%) |
695.35 |
679.15 - 698.70 |
0.3812 times |
Fri 26 September 2025 |
695.35 (-0.32%) |
700.40 |
690.15 - 726.00 |
1.3728 times |
Fri 19 September 2025 |
697.60 (-0.02%) |
697.75 |
696.50 - 708.45 |
0.7584 times |
Fri 12 September 2025 |
697.75 (-0.39%) |
700.45 |
696.00 - 726.00 |
2.0428 times |
Fri 05 September 2025 |
700.45 (-3.68%) |
727.65 |
698.20 - 749.35 |
2.4542 times |
Fri 29 August 2025 |
727.20 (-1.01%) |
731.75 |
715.30 - 754.80 |
0.6333 times |
Fri 22 August 2025 |
734.65 (1.53%) |
725.50 |
719.10 - 755.00 |
1.2209 times |
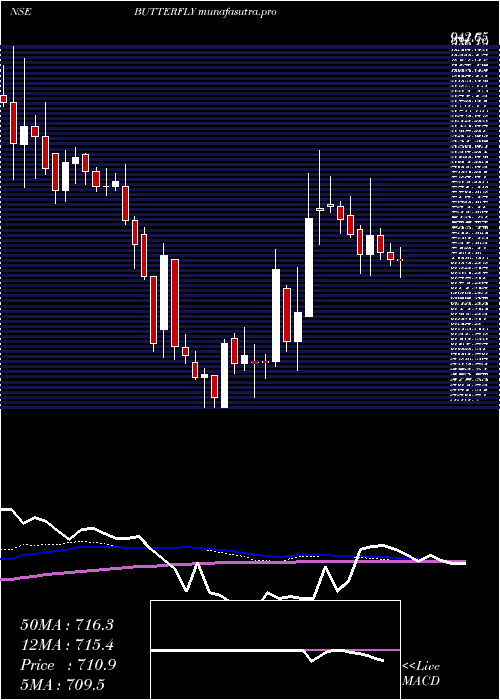
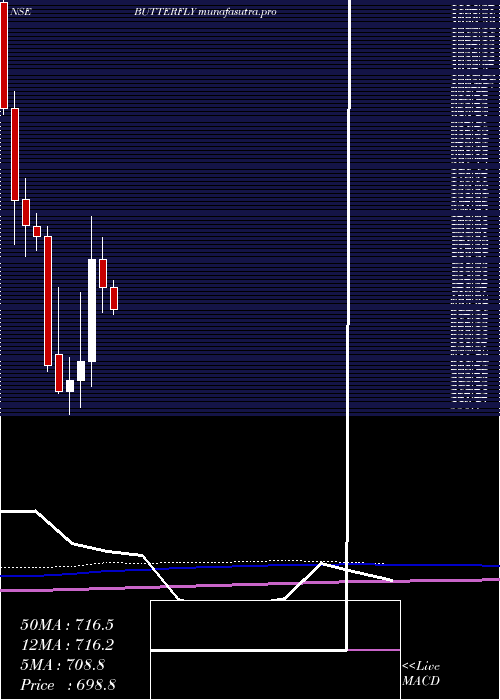
Monthly price and charts ButterflyGandhimathi Strong monthly Stock price targets for ButterflyGandhimathi BUTTERFLY are 699.98 and 751.43 | Monthly Target 1 | 659.08 | | Monthly Target 2 | 689.42 | | Monthly Target 3 | 710.53333333333 | | Monthly Target 4 | 740.87 | | Monthly Target 5 | 761.98 |
Monthly price and volumes Butterfly Gandhimathi
| Date |
Closing |
Open |
Range |
Volume |
Tue 28 October 2025 |
719.75 (5.12%) |
684.70 |
680.20 - 731.65 |
0.2117 times |
Tue 30 September 2025 |
684.70 (-5.84%) |
727.65 |
679.15 - 749.35 |
0.5662 times |
Fri 29 August 2025 |
727.20 (1.66%) |
715.30 |
695.05 - 794.90 |
2.1708 times |
Thu 31 July 2025 |
715.30 (-1.98%) |
729.80 |
691.90 - 785.90 |
0.934 times |
Mon 30 June 2025 |
729.75 (-5.07%) |
768.70 |
693.80 - 800.00 |
0.6735 times |
Fri 30 May 2025 |
768.70 (22.8%) |
626.05 |
590.30 - 829.90 |
2.4564 times |
Wed 30 April 2025 |
626.00 (4.6%) |
598.50 |
561.30 - 722.70 |
1.4996 times |
Fri 28 March 2025 |
598.45 (2.61%) |
583.25 |
550.70 - 630.95 |
0.4253 times |
Fri 28 February 2025 |
583.20 (-5.97%) |
634.95 |
580.85 - 729.25 |
0.7661 times |
Fri 31 January 2025 |
620.20 (-22.59%) |
801.25 |
611.25 - 814.95 |
0.2963 times |
Tue 31 December 2024 |
801.20 (-1.98%) |
815.60 |
781.20 - 833.40 |
0.4406 times |
DMA SMA EMA moving averages of Butterfly Gandhimathi BUTTERFLY
DMA (daily moving average) of Butterfly Gandhimathi BUTTERFLY
| DMA period | DMA value | | 5 day DMA | 706.92 | | 12 day DMA | 705.62 | | 20 day DMA | 700.7 | | 35 day DMA | 702.13 | | 50 day DMA | 710.13 | | 100 day DMA | 721.36 | | 150 day DMA | 704.07 | | 200 day DMA | 688.58 | EMA (exponential moving average) of Butterfly Gandhimathi BUTTERFLY
| EMA period | EMA current | EMA prev | EMA prev2 | | 5 day EMA | 708.63 | 703.07 | 703.48 | | 12 day EMA | 705.58 | 703.01 | 703.15 | | 20 day EMA | 704.73 | 703.15 | 703.25 | | 35 day EMA | 707.22 | 706.48 | 706.73 | | 50 day EMA | 710.56 | 710.19 | 710.51 |
SMA (simple moving average) of Butterfly Gandhimathi BUTTERFLY
| SMA period | SMA current | SMA prev | SMA prev2 | | 5 day SMA | 706.92 | 704.65 | 704.87 | | 12 day SMA | 705.62 | 704 | 704.09 | | 20 day SMA | 700.7 | 699.48 | 699.47 | | 35 day SMA | 702.13 | 701.58 | 701.7 | | 50 day SMA | 710.13 | 710.1 | 710.41 | | 100 day SMA | 721.36 | 721.72 | 722.17 | | 150 day SMA | 704.07 | 703.23 | 702.31 | | 200 day SMA | 688.58 | 688.88 | 689.35 |
|
|
