Bsl BSL full analysis,charts,indicators,moving averages,SMA,DMA,EMA,ADX,MACD,RSIBsl BSL WideScreen charts, DMA,SMA,EMA technical analysis, forecast prediction, by indicators ADX,MACD,RSI,CCI NSE stock exchange
operates under Textiles sector
Daily price and charts and targets Bsl Strong Daily Stock price targets for Bsl BSL are 179.1 and 189.3 | Daily Target 1 | 176.6 | | Daily Target 2 | 181.6 | | Daily Target 3 | 186.8 | | Daily Target 4 | 191.8 | | Daily Target 5 | 197 |
Daily price and volume Bsl
| Date |
Closing |
Open |
Range |
Volume |
Wed 29 October 2025 |
186.60 (-2.52%) |
191.42 |
181.80 - 192.00 |
0.3684 times |
Tue 28 October 2025 |
191.42 (1.97%) |
185.90 |
185.90 - 193.70 |
0.8142 times |
Mon 27 October 2025 |
187.72 (-1.13%) |
189.72 |
186.10 - 189.72 |
0.4363 times |
Fri 24 October 2025 |
189.86 (2.55%) |
185.22 |
179.41 - 192.80 |
1.0953 times |
Thu 23 October 2025 |
185.13 (-0.69%) |
182.10 |
182.00 - 196.79 |
1.4075 times |
Tue 21 October 2025 |
186.41 (2.1%) |
179.01 |
179.01 - 187.70 |
0.1981 times |
Mon 20 October 2025 |
182.57 (1.99%) |
179.00 |
175.81 - 184.79 |
1.0181 times |
Fri 17 October 2025 |
179.00 (-1.54%) |
184.90 |
174.75 - 184.90 |
0.7663 times |
Thu 16 October 2025 |
181.80 (3.88%) |
175.01 |
170.03 - 185.00 |
1.1037 times |
Wed 15 October 2025 |
175.01 (8.41%) |
161.43 |
160.99 - 187.00 |
2.7921 times |
Tue 14 October 2025 |
161.43 (-1.73%) |
167.42 |
158.00 - 170.00 |
1.1389 times |
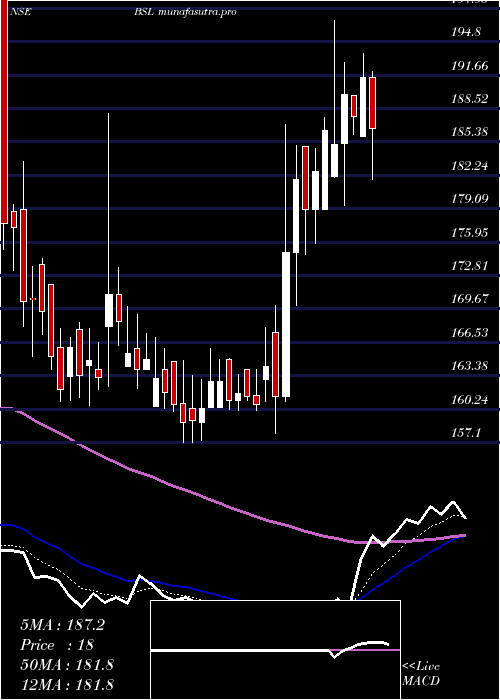
Weekly price and charts Bsl Strong weekly Stock price targets for Bsl BSL are 178.25 and 190.15 | Weekly Target 1 | 175.47 | | Weekly Target 2 | 181.03 | | Weekly Target 3 | 187.36666666667 | | Weekly Target 4 | 192.93 | | Weekly Target 5 | 199.27 |
Weekly price and volumes for Bsl
| Date |
Closing |
Open |
Range |
Volume |
Wed 29 October 2025 |
186.60 (-1.72%) |
189.72 |
181.80 - 193.70 |
0.2554 times |
Fri 24 October 2025 |
189.86 (6.07%) |
179.00 |
175.81 - 196.79 |
0.5867 times |
Fri 17 October 2025 |
179.00 (11.39%) |
163.00 |
158.00 - 187.00 |
0.9881 times |
Fri 10 October 2025 |
160.70 (-1.33%) |
160.37 |
160.10 - 165.00 |
0.1613 times |
Fri 03 October 2025 |
162.86 (1.35%) |
160.80 |
157.10 - 165.99 |
0.2348 times |
Fri 26 September 2025 |
160.69 (-2.9%) |
166.00 |
160.00 - 169.12 |
0.1721 times |
Fri 19 September 2025 |
165.49 (1.24%) |
164.39 |
160.57 - 188.00 |
2.0605 times |
Fri 12 September 2025 |
163.46 (-4.17%) |
173.88 |
161.00 - 174.44 |
0.4653 times |
Fri 05 September 2025 |
170.57 (2.65%) |
171.03 |
165.22 - 208.00 |
2.4925 times |
Wed 19 February 2025 |
166.16 (-4.62%) |
174.90 |
143.65 - 182.15 |
2.5833 times |
Fri 14 February 2025 |
174.21 (-14.93%) |
205.75 |
169.95 - 205.75 |
0.8049 times |

Monthly price and charts Bsl Strong monthly Stock price targets for Bsl BSL are 171.96 and 211.43 | Monthly Target 1 | 140.77 | | Monthly Target 2 | 163.68 | | Monthly Target 3 | 180.23666666667 | | Monthly Target 4 | 203.15 | | Monthly Target 5 | 219.71 |
Monthly price and volumes Bsl
| Date |
Closing |
Open |
Range |
Volume |
Wed 29 October 2025 |
186.60 (17.25%) |
159.00 |
157.32 - 196.79 |
0.2081 times |
Tue 30 September 2025 |
159.15 (-4.22%) |
171.03 |
157.10 - 208.00 |
0.5346 times |
Wed 19 February 2025 |
166.16 (-17.68%) |
204.90 |
143.65 - 212.00 |
0.378 times |
Fri 31 January 2025 |
201.85 (-26.22%) |
270.45 |
183.00 - 284.90 |
0.5668 times |
Tue 31 December 2024 |
273.59 (14.59%) |
236.10 |
236.00 - 331.85 |
4.1325 times |
Fri 29 November 2024 |
238.76 (-1.08%) |
241.37 |
216.07 - 279.70 |
0.922 times |
Thu 31 October 2024 |
241.37 (11.97%) |
219.46 |
199.10 - 253.80 |
0.6438 times |
Mon 30 September 2024 |
215.56 (-2.1%) |
221.00 |
210.81 - 235.55 |
0.3013 times |
Fri 30 August 2024 |
220.18 (-6.6%) |
240.99 |
205.01 - 257.77 |
1.4672 times |
Wed 31 July 2024 |
235.73 (15.71%) |
199.90 |
188.20 - 239.80 |
0.8457 times |
Fri 28 June 2024 |
203.73 (16.72%) |
182.90 |
160.20 - 209.45 |
0.4686 times |

DMA SMA EMA moving averages of Bsl BSL
DMA (daily moving average) of Bsl BSL
| DMA period | DMA value | | 5 day DMA | 188.15 | | 12 day DMA | 180.94 | | 20 day DMA | 173.07 | | 35 day DMA | 169.27 | | 50 day DMA | 172.49 | | 100 day DMA | 212.51 | | 150 day DMA | 216.77 | | 200 day DMA | 216.16 | EMA (exponential moving average) of Bsl BSL
| EMA period | EMA current | EMA prev | EMA prev2 | | 5 day EMA | 187.2 | 187.5 | 185.54 | | 12 day EMA | 181.77 | 180.89 | 178.98 | | 20 day EMA | 177.78 | 176.85 | 175.32 | | 35 day EMA | 176.68 | 176.1 | 175.2 | | 50 day EMA | 176.6 | 176.19 | 175.57 |
SMA (simple moving average) of Bsl BSL
| SMA period | SMA current | SMA prev | SMA prev2 | | 5 day SMA | 188.15 | 188.11 | 186.34 | | 12 day SMA | 180.94 | 178.78 | 176.28 | | 20 day SMA | 173.07 | 171.69 | 170.15 | | 35 day SMA | 169.27 | 168.78 | 168.19 | | 50 day SMA | 172.49 | 172.91 | 173.21 | | 100 day SMA | 212.51 | 212.89 | 213.21 | | 150 day SMA | 216.77 | 216.98 | 217.14 | | 200 day SMA | 216.16 | 216.2 | 216.23 |
|
|
