BrooksLab BROOKS_BE full analysis,charts,indicators,moving averages,SMA,DMA,EMA,ADX,MACD,RSIBrooks Lab BROOKS_BE WideScreen charts, DMA,SMA,EMA technical analysis, forecast prediction, by indicators ADX,MACD,RSI,CCI NSE stock exchange
Daily price and charts and targets BrooksLab Strong Daily Stock price targets for BrooksLab BROOKS_BE are 154.67 and 154.67 | Daily Target 1 | 154.67 | | Daily Target 2 | 154.67 | | Daily Target 3 | 154.67 | | Daily Target 4 | 154.67 | | Daily Target 5 | 154.67 |
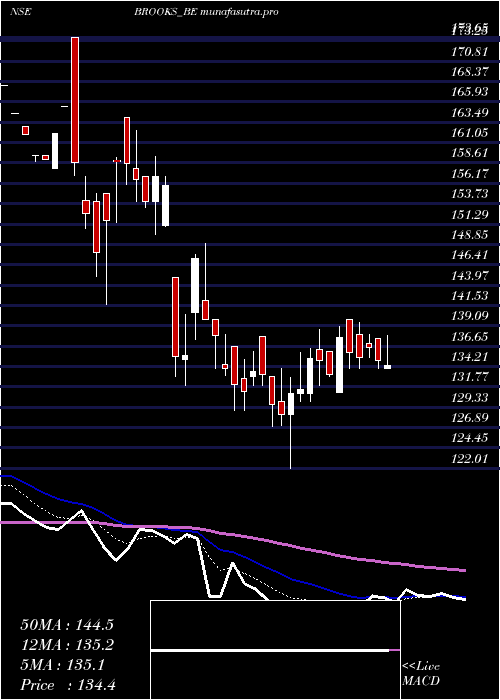
Daily price and volume Brooks Lab
| Date |
Closing |
Open |
Range |
Volume |
Mon 14 July 2025 |
154.67 (2%) |
154.67 |
154.67 - 154.67 |
0.4498 times |
Fri 11 July 2025 |
151.64 (2%) |
151.64 |
151.64 - 151.64 |
1.2944 times |
Thu 10 July 2025 |
148.67 (2%) |
148.67 |
148.67 - 148.67 |
0.8092 times |
Wed 09 July 2025 |
145.76 (1.99%) |
144.15 |
144.15 - 145.76 |
1.3084 times |
Tue 08 July 2025 |
142.91 (2%) |
142.91 |
142.90 - 142.91 |
2.1031 times |
Mon 07 July 2025 |
140.11 (1.99%) |
134.62 |
134.62 - 140.11 |
0.9764 times |
Fri 04 July 2025 |
137.37 (-2%) |
137.37 |
137.37 - 137.37 |
1.0818 times |
Thu 03 July 2025 |
140.18 (-2.01%) |
140.19 |
140.18 - 140.19 |
0.2984 times |
Wed 02 July 2025 |
143.05 (-2%) |
143.60 |
143.05 - 143.60 |
0.3948 times |
Tue 01 July 2025 |
145.97 (-2%) |
145.97 |
145.97 - 146.14 |
1.2836 times |
Mon 30 June 2025 |
148.95 (-2%) |
151.99 |
148.95 - 151.99 |
0.6157 times |
Weekly price and charts BrooksLab Strong weekly Stock price targets for BrooksLab BROOKS_BE are 154.67 and 154.67 | Weekly Target 1 | 154.67 | | Weekly Target 2 | 154.67 | | Weekly Target 3 | 154.67 | | Weekly Target 4 | 154.67 | | Weekly Target 5 | 154.67 |
Weekly price and volumes for Brooks Lab
| Date |
Closing |
Open |
Range |
Volume |
Mon 14 July 2025 |
154.67 (2%) |
154.67 |
154.67 - 154.67 |
0.0464 times |
Fri 11 July 2025 |
151.64 (10.39%) |
134.62 |
134.62 - 151.64 |
0.6696 times |
Fri 04 July 2025 |
137.37 (-9.62%) |
151.99 |
137.37 - 151.99 |
0.379 times |
Fri 27 June 2025 |
151.99 (15.37%) |
131.69 |
128.00 - 152.90 |
3.5411 times |
Fri 20 June 2025 |
131.74 (4.82%) |
126.10 |
123.00 - 134.00 |
0.9985 times |
Fri 13 June 2025 |
125.68 (-5.44%) |
130.20 |
121.01 - 133.20 |
1.5137 times |
Fri 06 June 2025 |
132.91 (-7.27%) |
143.33 |
132.40 - 155.95 |
1.0711 times |
Fri 30 May 2025 |
143.33 (6.65%) |
134.05 |
128.00 - 143.33 |
0.5871 times |
Fri 23 May 2025 |
134.39 (-2.4%) |
139.80 |
134.00 - 139.80 |
0.4967 times |
Fri 16 May 2025 |
137.69 (5.13%) |
131.00 |
130.00 - 139.00 |
0.6967 times |
Fri 09 May 2025 |
130.97 (-0.22%) |
133.00 |
122.01 - 137.80 |
0.2884 times |

Monthly price and charts BrooksLab Strong monthly Stock price targets for BrooksLab BROOKS_BE are 144.65 and 164.7 | Monthly Target 1 | 127.94 | | Monthly Target 2 | 141.3 | | Monthly Target 3 | 147.98666666667 | | Monthly Target 4 | 161.35 | | Monthly Target 5 | 168.04 |
Monthly price and volumes Brooks Lab
| Date |
Closing |
Open |
Range |
Volume |
Mon 14 July 2025 |
154.67 (3.84%) |
145.97 |
134.62 - 154.67 |
0.1546 times |
Mon 30 June 2025 |
148.95 (3.92%) |
143.33 |
121.01 - 155.95 |
1.0774 times |
Fri 30 May 2025 |
143.33 (8.5%) |
132.76 |
122.01 - 143.33 |
0.3148 times |
Wed 30 April 2025 |
132.10 (-15.24%) |
144.90 |
129.00 - 148.99 |
0.1805 times |
Fri 07 February 2025 |
155.85 (-1.81%) |
164.00 |
150.00 - 164.00 |
0.0824 times |
Fri 31 January 2025 |
158.72 (-11.89%) |
183.74 |
141.60 - 198.86 |
0.7778 times |
Tue 31 December 2024 |
180.14 (29.6%) |
139.00 |
135.00 - 180.14 |
0.6599 times |
Fri 29 November 2024 |
139.00 (-0.17%) |
142.00 |
131.05 - 150.20 |
1.1813 times |
Thu 31 October 2024 |
139.24 (-7.48%) |
152.90 |
125.00 - 152.90 |
1.1415 times |
Mon 30 September 2024 |
150.50 (22.65%) |
122.50 |
121.01 - 163.50 |
4.4297 times |
Fri 30 August 2024 |
122.71 (46.41%) |
127.00 |
117.00 - 128.00 |
0.3779 times |
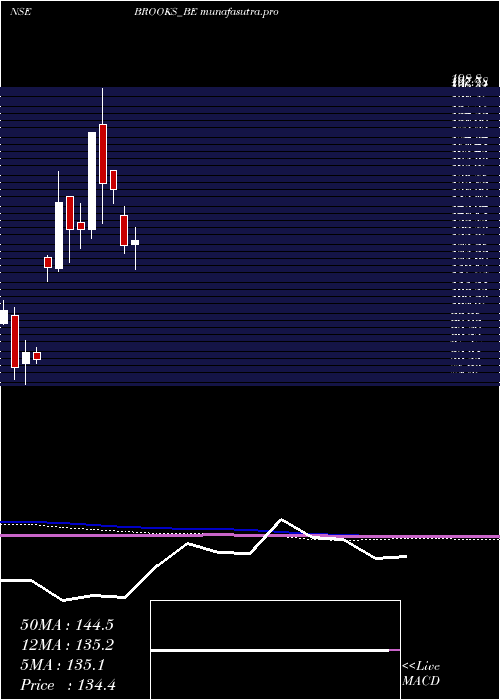
DMA SMA EMA moving averages of Brooks Lab BROOKS_BE
DMA (daily moving average) of Brooks Lab BROOKS_BE
| DMA period | DMA value | | 5 day DMA | 148.73 | | 12 day DMA | 145.94 | | 20 day DMA | 142.21 | | 35 day DMA | 138.89 | | 50 day DMA | 137.35 | | 100 day DMA | 149.16 | | 150 day DMA | 146.56 | | 200 day DMA | 137.67 | EMA (exponential moving average) of Brooks Lab BROOKS_BE
| EMA period | EMA current | EMA prev | EMA prev2 | | 5 day EMA | 149.67 | 147.17 | 144.94 | | 12 day EMA | 145.94 | 144.35 | 143.03 | | 20 day EMA | 143.41 | 142.22 | 141.23 | | 35 day EMA | 140.83 | 140.01 | 139.33 | | 50 day EMA | 138.23 | 137.56 | 136.99 |
SMA (simple moving average) of Brooks Lab BROOKS_BE
| SMA period | SMA current | SMA prev | SMA prev2 | | 5 day SMA | 148.73 | 145.82 | 142.96 | | 12 day SMA | 145.94 | 145.55 | 145.33 | | 20 day SMA | 142.21 | 140.68 | 139.39 | | 35 day SMA | 138.89 | 138.31 | 137.82 | | 50 day SMA | 137.35 | 136.93 | 136.52 | | 100 day SMA | 149.16 | 149.07 | 148.99 | | 150 day SMA | 146.56 | 146.51 | 146.47 | | 200 day SMA | 137.67 | 137.3 | 136.93 |
|
|
