BrooksLaboratories BROOKS full analysis,charts,indicators,moving averages,SMA,DMA,EMA,ADX,MACD,RSIBrooks Laboratories BROOKS WideScreen charts, DMA,SMA,EMA technical analysis, forecast prediction, by indicators ADX,MACD,RSI,CCI NSE stock exchange
operates under Pharmaceuticals sector
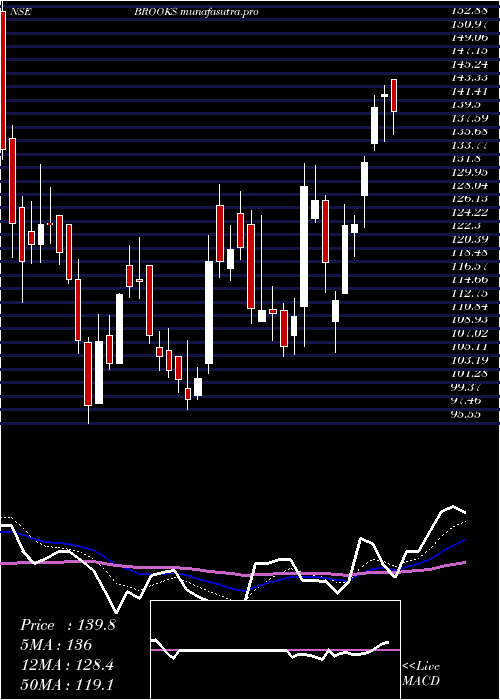
Daily price and charts and targets BrooksLaboratories Strong Daily Stock price targets for BrooksLaboratories BROOKS are 100.99 and 110.89 | Daily Target 1 | 99.06 | | Daily Target 2 | 102.92 | | Daily Target 3 | 108.96 | | Daily Target 4 | 112.82 | | Daily Target 5 | 118.86 |
Daily price and volume Brooks Laboratories
| Date |
Closing |
Open |
Range |
Volume |
Tue 28 October 2025 |
106.78 (-4.75%) |
112.20 |
105.10 - 115.00 |
1.9845 times |
Mon 27 October 2025 |
112.10 (-1.06%) |
114.70 |
111.30 - 119.41 |
2.1518 times |
Fri 24 October 2025 |
113.30 (-6.83%) |
120.45 |
111.51 - 123.00 |
2.4567 times |
Thu 23 October 2025 |
121.61 (0.55%) |
121.00 |
120.19 - 123.54 |
0.6384 times |
Tue 21 October 2025 |
120.95 (0.45%) |
122.99 |
119.99 - 123.10 |
0.1244 times |
Mon 20 October 2025 |
120.41 (-1.65%) |
121.44 |
119.00 - 124.14 |
0.5483 times |
Fri 17 October 2025 |
122.43 (-0.22%) |
125.15 |
121.12 - 125.22 |
0.3674 times |
Thu 16 October 2025 |
122.70 (-0.39%) |
124.35 |
122.02 - 126.43 |
0.1979 times |
Wed 15 October 2025 |
123.18 (-2.5%) |
129.19 |
122.25 - 129.44 |
1.0025 times |
Tue 14 October 2025 |
126.34 (-1.38%) |
128.90 |
125.02 - 130.98 |
0.5282 times |
Mon 13 October 2025 |
128.11 (2.64%) |
125.30 |
122.10 - 130.00 |
0.5997 times |
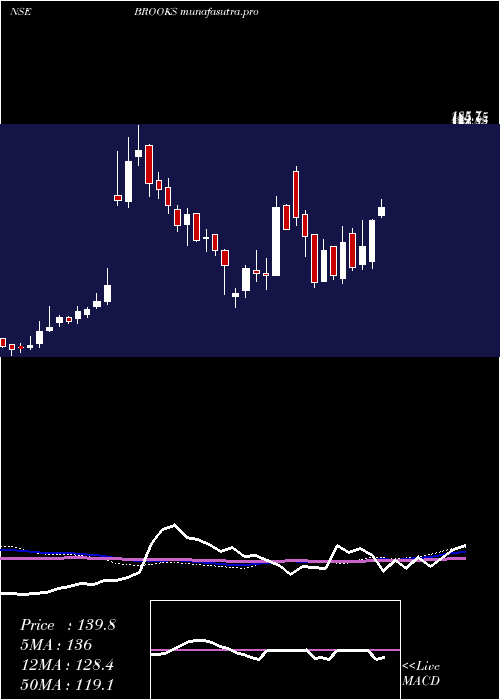
Weekly price and charts BrooksLaboratories Strong weekly Stock price targets for BrooksLaboratories BROOKS are 98.79 and 113.1 | Weekly Target 1 | 96.12 | | Weekly Target 2 | 101.45 | | Weekly Target 3 | 110.43 | | Weekly Target 4 | 115.76 | | Weekly Target 5 | 124.74 |
Weekly price and volumes for Brooks Laboratories
| Date |
Closing |
Open |
Range |
Volume |
Tue 28 October 2025 |
106.78 (-5.75%) |
114.70 |
105.10 - 119.41 |
1.1723 times |
Fri 24 October 2025 |
113.30 (-7.46%) |
121.44 |
111.51 - 124.14 |
1.0679 times |
Fri 17 October 2025 |
122.43 (-1.91%) |
125.30 |
121.12 - 130.98 |
0.764 times |
Fri 10 October 2025 |
124.81 (-7.78%) |
138.00 |
123.91 - 138.00 |
1.0741 times |
Fri 03 October 2025 |
135.34 (-0.12%) |
142.27 |
130.00 - 142.27 |
1.1859 times |
Fri 26 September 2025 |
135.50 (-9.29%) |
145.00 |
135.00 - 153.99 |
0.5139 times |
Fri 19 September 2025 |
149.37 (-6.08%) |
161.40 |
148.30 - 163.90 |
0.7831 times |
Fri 12 September 2025 |
159.04 (13.79%) |
152.99 |
144.20 - 160.19 |
1.5349 times |
Thu 17 April 2025 |
139.77 (5.45%) |
135.21 |
134.21 - 144.36 |
0.8206 times |
Fri 11 April 2025 |
132.55 (12.03%) |
110.00 |
105.60 - 133.40 |
1.0834 times |
Fri 04 April 2025 |
118.32 (11.24%) |
108.00 |
105.26 - 132.50 |
3.2165 times |
Monthly price and charts BrooksLaboratories Strong monthly Stock price targets for BrooksLaboratories BROOKS are 89.32 and 122.56 | Monthly Target 1 | 83.5 | | Monthly Target 2 | 95.14 | | Monthly Target 3 | 116.74 | | Monthly Target 4 | 128.38 | | Monthly Target 5 | 149.98 |
Monthly price and volumes Brooks Laboratories
| Date |
Closing |
Open |
Range |
Volume |
Tue 28 October 2025 |
106.78 (-20.46%) |
134.25 |
105.10 - 138.34 |
0.5149 times |
Tue 30 September 2025 |
134.25 (-3.95%) |
152.99 |
132.35 - 163.90 |
0.3932 times |
Thu 17 April 2025 |
139.77 (31.41%) |
108.00 |
105.26 - 144.36 |
0.5743 times |
Fri 28 March 2025 |
106.36 (8.42%) |
98.40 |
97.41 - 129.50 |
1.2253 times |
Fri 28 February 2025 |
98.10 (-23.22%) |
160.00 |
95.55 - 162.84 |
0.3087 times |
Tue 27 August 2024 |
127.77 (37.53%) |
93.50 |
93.50 - 146.10 |
3.0059 times |
Wed 31 July 2024 |
92.90 (-13.54%) |
90.00 |
84.00 - 94.78 |
0.5893 times |
Fri 15 March 2024 |
107.45 (-9.44%) |
118.00 |
91.25 - 124.70 |
0.6149 times |
Thu 29 February 2024 |
118.65 (-19.89%) |
147.25 |
116.80 - 150.20 |
0.8939 times |
Wed 31 January 2024 |
148.10 (3.13%) |
143.25 |
140.00 - 185.70 |
1.8795 times |
Fri 29 December 2023 |
143.60 (49.12%) |
146.25 |
140.75 - 171.00 |
0.8461 times |
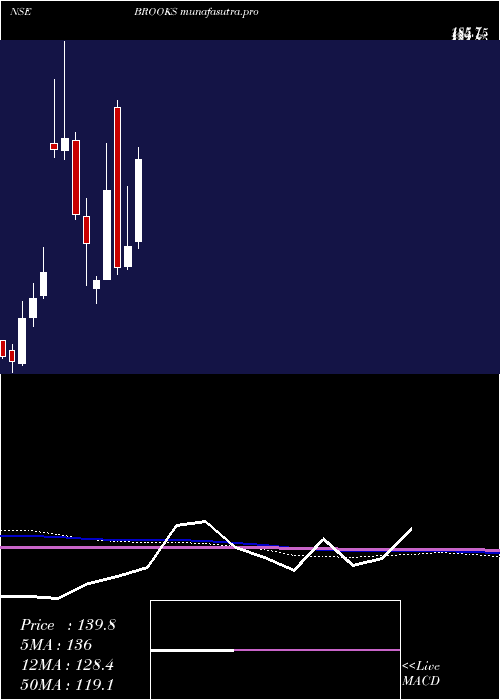
DMA SMA EMA moving averages of Brooks Laboratories BROOKS
DMA (daily moving average) of Brooks Laboratories BROOKS
| DMA period | DMA value | | 5 day DMA | 114.95 | | 12 day DMA | 120.23 | | 20 day DMA | 124.86 | | 35 day DMA | 135.35 | | 50 day DMA | 131.58 | | 100 day DMA | 122.94 | | 150 day DMA | 124.58 | | 200 day DMA | 118.53 | EMA (exponential moving average) of Brooks Laboratories BROOKS
| EMA period | EMA current | EMA prev | EMA prev2 | | 5 day EMA | 113.45 | 116.79 | 119.14 | | 12 day EMA | 119.4 | 121.69 | 123.43 | | 20 day EMA | 123.63 | 125.4 | 126.8 | | 35 day EMA | 125.9 | 127.03 | 127.91 | | 50 day EMA | 128.58 | 129.47 | 130.18 |
SMA (simple moving average) of Brooks Laboratories BROOKS
| SMA period | SMA current | SMA prev | SMA prev2 | | 5 day SMA | 114.95 | 117.67 | 119.74 | | 12 day SMA | 120.23 | 122.24 | 123.6 | | 20 day SMA | 124.86 | 126.3 | 127.77 | | 35 day SMA | 135.35 | 136.29 | 137.15 | | 50 day SMA | 131.58 | 131.85 | 132.01 | | 100 day SMA | 122.94 | 122.8 | 122.59 | | 150 day SMA | 124.58 | 125.05 | 125.47 | | 200 day SMA | 118.53 | 118.31 | 118.07 |
|
|
