BombayDyeing BOMDYEING full analysis,charts,indicators,moving averages,SMA,DMA,EMA,ADX,MACD,RSIBombay Dyeing BOMDYEING WideScreen charts, DMA,SMA,EMA technical analysis, forecast prediction, by indicators ADX,MACD,RSI,CCI NSE stock exchange
operates under Textiles sector
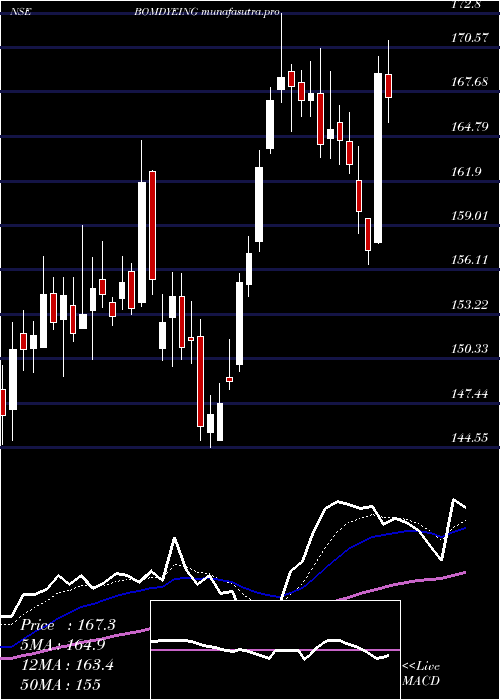
Daily price and charts and targets BombayDyeing Strong Daily Stock price targets for BombayDyeing BOMDYEING are 165.47 and 168.97 | Daily Target 1 | 164.81 | | Daily Target 2 | 166.13 | | Daily Target 3 | 168.31333333333 | | Daily Target 4 | 169.63 | | Daily Target 5 | 171.81 |
Daily price and volume Bombay Dyeing
| Date |
Closing |
Open |
Range |
Volume |
Tue 28 October 2025 |
167.44 (-0.84%) |
169.50 |
167.00 - 170.50 |
1.147 times |
Mon 27 October 2025 |
168.85 (-2.09%) |
173.00 |
167.90 - 174.10 |
1.3605 times |
Fri 24 October 2025 |
172.45 (-1.07%) |
173.91 |
171.40 - 173.92 |
0.5567 times |
Thu 23 October 2025 |
174.32 (-0.22%) |
176.00 |
173.60 - 178.36 |
1.3986 times |
Tue 21 October 2025 |
174.71 (-0.03%) |
175.00 |
174.10 - 176.00 |
0.3322 times |
Mon 20 October 2025 |
174.76 (1.13%) |
173.50 |
172.56 - 176.30 |
0.9021 times |
Fri 17 October 2025 |
172.81 (0.23%) |
172.00 |
170.51 - 176.09 |
1.8923 times |
Thu 16 October 2025 |
172.41 (0.15%) |
172.44 |
171.60 - 175.55 |
0.8048 times |
Wed 15 October 2025 |
172.16 (1.43%) |
170.50 |
170.31 - 172.51 |
0.5742 times |
Tue 14 October 2025 |
169.74 (-1.39%) |
171.90 |
168.38 - 173.41 |
1.0316 times |
Mon 13 October 2025 |
172.14 (-1.84%) |
172.63 |
171.60 - 174.00 |
0.796 times |
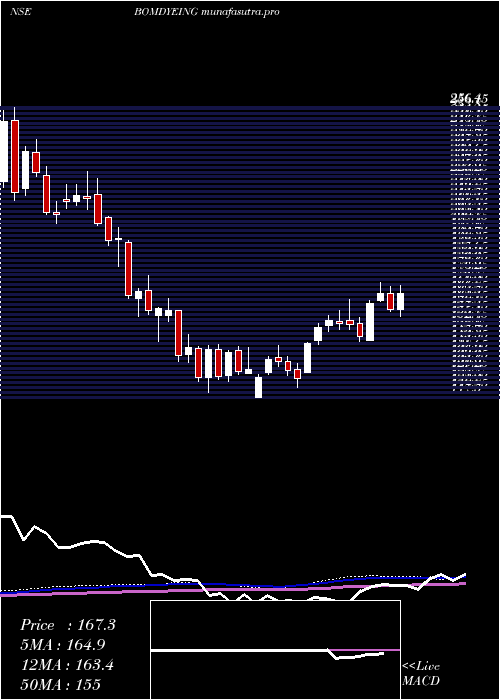
Weekly price and charts BombayDyeing Strong weekly Stock price targets for BombayDyeing BOMDYEING are 163.67 and 170.77 | Weekly Target 1 | 162.41 | | Weekly Target 2 | 164.93 | | Weekly Target 3 | 169.51333333333 | | Weekly Target 4 | 172.03 | | Weekly Target 5 | 176.61 |
Weekly price and volumes for Bombay Dyeing
| Date |
Closing |
Open |
Range |
Volume |
Tue 28 October 2025 |
167.44 (-2.91%) |
173.00 |
167.00 - 174.10 |
0.2928 times |
Fri 24 October 2025 |
172.45 (-0.21%) |
173.50 |
171.40 - 178.36 |
0.3724 times |
Fri 17 October 2025 |
172.81 (-1.46%) |
172.63 |
168.38 - 176.09 |
0.5953 times |
Fri 10 October 2025 |
175.37 (-1.2%) |
177.64 |
169.55 - 180.75 |
0.6609 times |
Fri 03 October 2025 |
177.50 (5.33%) |
168.90 |
163.00 - 178.50 |
0.8249 times |
Fri 26 September 2025 |
168.51 (-8.82%) |
184.00 |
167.33 - 186.90 |
0.7805 times |
Fri 19 September 2025 |
184.82 (0.65%) |
183.51 |
181.76 - 191.00 |
1.5303 times |
Fri 12 September 2025 |
183.63 (3.61%) |
177.70 |
174.92 - 195.45 |
2.6787 times |
Fri 05 September 2025 |
177.23 (4.27%) |
170.00 |
169.26 - 183.95 |
1.0959 times |
Fri 29 August 2025 |
169.97 (-4.61%) |
179.50 |
168.55 - 184.00 |
1.1683 times |
Fri 22 August 2025 |
178.18 (6.98%) |
169.00 |
165.27 - 181.90 |
2.0996 times |
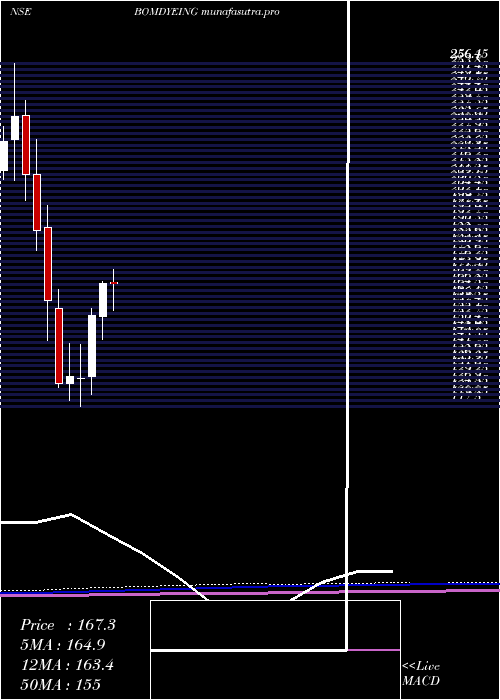
Monthly price and charts BombayDyeing Strong monthly Stock price targets for BombayDyeing BOMDYEING are 166.42 and 181.77 | Monthly Target 1 | 155.85 | | Monthly Target 2 | 161.64 | | Monthly Target 3 | 171.19666666667 | | Monthly Target 4 | 176.99 | | Monthly Target 5 | 186.55 |
Monthly price and volumes Bombay Dyeing
| Date |
Closing |
Open |
Range |
Volume |
Tue 28 October 2025 |
167.44 (1.31%) |
165.65 |
165.40 - 180.75 |
0.3213 times |
Tue 30 September 2025 |
165.27 (-2.77%) |
170.00 |
163.00 - 195.45 |
0.8733 times |
Fri 29 August 2025 |
169.97 (-0.47%) |
170.50 |
157.57 - 184.00 |
0.7894 times |
Thu 31 July 2025 |
170.78 (2.2%) |
167.85 |
156.46 - 196.75 |
4.2889 times |
Mon 30 June 2025 |
167.10 (8.22%) |
153.81 |
144.55 - 168.00 |
0.7402 times |
Fri 30 May 2025 |
154.41 (19.64%) |
129.57 |
122.32 - 157.00 |
0.7343 times |
Wed 30 April 2025 |
129.06 (-0.51%) |
129.00 |
117.50 - 142.45 |
0.4875 times |
Fri 28 March 2025 |
129.72 (2.22%) |
127.00 |
120.00 - 143.00 |
0.6427 times |
Fri 28 February 2025 |
126.90 (-20.81%) |
157.00 |
125.20 - 164.74 |
0.4557 times |
Fri 31 January 2025 |
160.25 (-15.01%) |
189.90 |
144.42 - 198.95 |
0.6666 times |
Tue 31 December 2024 |
188.56 (-10.75%) |
211.49 |
180.52 - 225.70 |
0.8113 times |
DMA SMA EMA moving averages of Bombay Dyeing BOMDYEING
DMA (daily moving average) of Bombay Dyeing BOMDYEING
| DMA period | DMA value | | 5 day DMA | 171.55 | | 12 day DMA | 172.26 | | 20 day DMA | 172 | | 35 day DMA | 175.95 | | 50 day DMA | 175.18 | | 100 day DMA | 169.28 | | 150 day DMA | 158.81 | | 200 day DMA | 156.43 | EMA (exponential moving average) of Bombay Dyeing BOMDYEING
| EMA period | EMA current | EMA prev | EMA prev2 | | 5 day EMA | 170.41 | 171.89 | 173.41 | | 12 day EMA | 171.87 | 172.67 | 173.37 | | 20 day EMA | 172.71 | 173.27 | 173.73 | | 35 day EMA | 173.11 | 173.44 | 173.71 | | 50 day EMA | 173.89 | 174.15 | 174.37 |
SMA (simple moving average) of Bombay Dyeing BOMDYEING
| SMA period | SMA current | SMA prev | SMA prev2 | | 5 day SMA | 171.55 | 173.02 | 173.81 | | 12 day SMA | 172.26 | 172.56 | 172.81 | | 20 day SMA | 172 | 172.06 | 172.25 | | 35 day SMA | 175.95 | 176.23 | 176.45 | | 50 day SMA | 175.18 | 175.22 | 175.14 | | 100 day SMA | 169.28 | 169.15 | 169 | | 150 day SMA | 158.81 | 158.59 | 158.33 | | 200 day SMA | 156.43 | 156.49 | 156.61 |
|
|
