BohraIndustries BOHRAIND_BE full analysis,charts,indicators,moving averages,SMA,DMA,EMA,ADX,MACD,RSIBohra Industries BOHRAIND_BE WideScreen charts, DMA,SMA,EMA technical analysis, forecast prediction, by indicators ADX,MACD,RSI,CCI NSE stock exchange
Daily price and charts and targets BohraIndustries Strong Daily Stock price targets for BohraIndustries BOHRAIND_BE are 24.28 and 26.97 | Daily Target 1 | 23.82 | | Daily Target 2 | 24.74 | | Daily Target 3 | 26.513333333333 | | Daily Target 4 | 27.43 | | Daily Target 5 | 29.2 |
Daily price and volume Bohra Industries
| Date |
Closing |
Open |
Range |
Volume |
Fri 11 July 2025 |
25.65 (-4.82%) |
28.29 |
25.60 - 28.29 |
1.5089 times |
Thu 10 July 2025 |
26.95 (1.66%) |
26.99 |
26.05 - 27.40 |
0.0358 times |
Wed 09 July 2025 |
26.51 (1.26%) |
27.39 |
26.04 - 27.39 |
0.7688 times |
Tue 08 July 2025 |
26.18 (2.99%) |
26.69 |
25.15 - 26.69 |
0.2978 times |
Mon 07 July 2025 |
25.42 (-3.57%) |
26.89 |
25.05 - 27.67 |
1.2403 times |
Fri 04 July 2025 |
26.36 (1.03%) |
27.35 |
26.00 - 27.35 |
0.2732 times |
Thu 03 July 2025 |
26.09 (-1.66%) |
25.55 |
25.55 - 27.80 |
0.3436 times |
Wed 02 July 2025 |
26.53 (-4.4%) |
27.75 |
26.36 - 28.50 |
3.3028 times |
Tue 01 July 2025 |
27.75 (-5.03%) |
29.30 |
27.75 - 30.68 |
1.001 times |
Mon 30 June 2025 |
29.22 (4.66%) |
29.00 |
27.40 - 29.31 |
1.2279 times |
Fri 27 June 2025 |
27.92 (1.97%) |
27.38 |
27.00 - 27.92 |
2.0335 times |
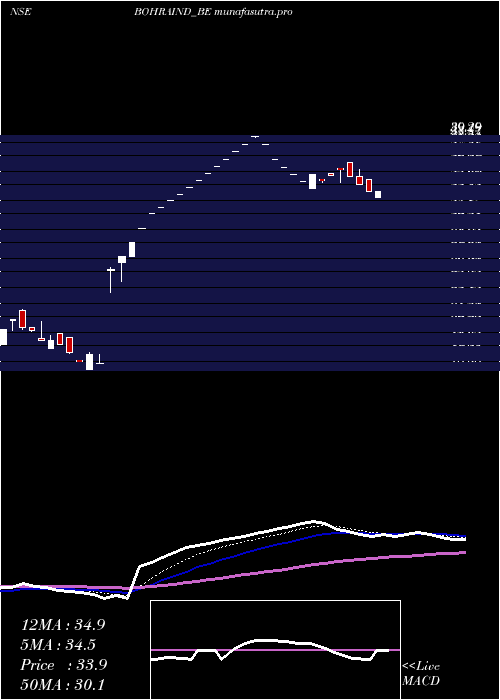
Weekly price and charts BohraIndustries Strong weekly Stock price targets for BohraIndustries BOHRAIND_BE are 23.73 and 26.97 | Weekly Target 1 | 23.09 | | Weekly Target 2 | 24.37 | | Weekly Target 3 | 26.33 | | Weekly Target 4 | 27.61 | | Weekly Target 5 | 29.57 |
Weekly price and volumes for Bohra Industries
| Date |
Closing |
Open |
Range |
Volume |
Fri 11 July 2025 |
25.65 (-2.69%) |
26.89 |
25.05 - 28.29 |
0.9335 times |
Fri 04 July 2025 |
26.36 (-5.59%) |
29.00 |
25.55 - 30.68 |
1.4903 times |
Fri 27 June 2025 |
27.92 (-3.12%) |
28.26 |
27.00 - 28.26 |
2.5124 times |
Fri 20 June 2025 |
28.82 (-9.31%) |
31.94 |
28.82 - 31.94 |
1.1767 times |
Fri 13 June 2025 |
31.78 (-3.87%) |
33.71 |
31.14 - 33.71 |
0.1435 times |
Fri 06 June 2025 |
33.06 (-5.03%) |
34.11 |
32.74 - 34.11 |
0.0751 times |
Fri 30 May 2025 |
34.81 (-3.06%) |
35.91 |
34.81 - 37.35 |
0.6915 times |
Fri 23 May 2025 |
35.91 (23.78%) |
28.50 |
28.50 - 35.91 |
1.8046 times |
Fri 16 May 2025 |
29.01 (2.22%) |
28.38 |
28.38 - 30.89 |
0.4918 times |
Fri 09 May 2025 |
28.38 (-2.57%) |
29.15 |
28.15 - 32.05 |
0.6806 times |
Fri 02 May 2025 |
29.13 (-1.92%) |
29.61 |
28.00 - 31.20 |
0.5946 times |
Monthly price and charts BohraIndustries Strong monthly Stock price targets for BohraIndustries BOHRAIND_BE are 22.54 and 28.17 | Monthly Target 1 | 21.5 | | Monthly Target 2 | 23.57 | | Monthly Target 3 | 27.126666666667 | | Monthly Target 4 | 29.2 | | Monthly Target 5 | 32.76 |
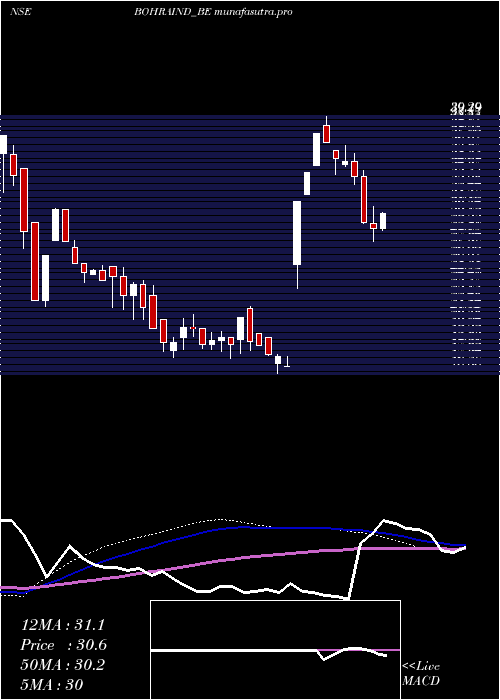
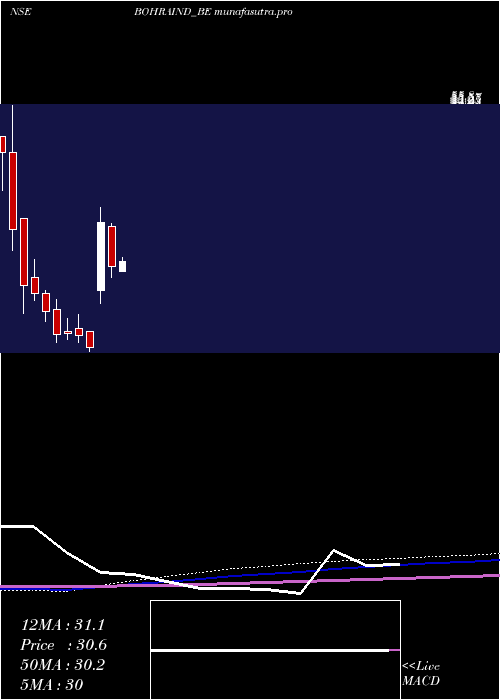
Monthly price and volumes Bohra Industries
| Date |
Closing |
Open |
Range |
Volume |
Fri 11 July 2025 |
25.65 (-12.22%) |
29.30 |
25.05 - 30.68 |
0.6245 times |
Mon 30 June 2025 |
29.22 (-16.06%) |
34.11 |
27.00 - 34.11 |
1.2352 times |
Fri 30 May 2025 |
34.81 (17.05%) |
29.00 |
28.15 - 37.35 |
1.1222 times |
Wed 30 April 2025 |
29.74 (-19.56%) |
36.23 |
28.00 - 36.72 |
0.7216 times |
Fri 28 March 2025 |
36.97 (121.51%) |
25.90 |
23.77 - 39.29 |
1.2121 times |
Mon 24 June 2024 |
16.69 (-10.27%) |
19.30 |
16.06 - 19.30 |
0.3547 times |
Mon 27 May 2024 |
18.60 (-2.11%) |
19.80 |
17.45 - 22.10 |
0.6788 times |
Tue 30 April 2024 |
19.00 (0.8%) |
19.30 |
18.00 - 21.40 |
0.9727 times |
Thu 28 March 2024 |
18.85 (-16.22%) |
22.85 |
17.50 - 24.50 |
1.5575 times |
Thu 29 February 2024 |
22.50 (-11.42%) |
25.40 |
20.90 - 25.85 |
1.5206 times |
Wed 31 January 2024 |
25.40 (-5.05%) |
28.05 |
24.25 - 31.00 |
0.9932 times |
DMA SMA EMA moving averages of Bohra Industries BOHRAIND_BE
DMA (daily moving average) of Bohra Industries BOHRAIND_BE
| DMA period | DMA value | | 5 day DMA | 26.14 | | 12 day DMA | 26.83 | | 20 day DMA | 27.76 | | 35 day DMA | 30.3 | | 50 day DMA | 30.49 | | 100 day DMA | 30.08 | | 150 day DMA | 26.71 | | 200 day DMA | 26.48 | EMA (exponential moving average) of Bohra Industries BOHRAIND_BE
| EMA period | EMA current | EMA prev | EMA prev2 | | 5 day EMA | 26.26 | 26.57 | 26.38 | | 12 day EMA | 26.92 | 27.15 | 27.19 | | 20 day EMA | 27.77 | 27.99 | 28.1 | | 35 day EMA | 28.77 | 28.95 | 29.07 | | 50 day EMA | 29.95 | 30.13 | 30.26 |
SMA (simple moving average) of Bohra Industries BOHRAIND_BE
| SMA period | SMA current | SMA prev | SMA prev2 | | 5 day SMA | 26.14 | 26.28 | 26.11 | | 12 day SMA | 26.83 | 26.97 | 27.04 | | 20 day SMA | 27.76 | 28.06 | 28.27 | | 35 day SMA | 30.3 | 30.6 | 30.83 | | 50 day SMA | 30.49 | 30.56 | 30.61 | | 100 day SMA | 30.08 | 30.01 | 29.92 | | 150 day SMA | 26.71 | 26.68 | 26.65 | | 200 day SMA | 26.48 | 26.49 | 26.5 |
|
|
