BohraIndustries BOHRAIND full analysis,charts,indicators,moving averages,SMA,DMA,EMA,ADX,MACD,RSIBohra Industries BOHRAIND WideScreen charts, DMA,SMA,EMA technical analysis, forecast prediction, by indicators ADX,MACD,RSI,CCI NSE stock exchange
Daily price and charts and targets BohraIndustries Strong Daily Stock price targets for BohraIndustries BOHRAIND are 20.61 and 21.63 | Daily Target 1 | 20.44 | | Daily Target 2 | 20.78 | | Daily Target 3 | 21.456666666667 | | Daily Target 4 | 21.8 | | Daily Target 5 | 22.48 |
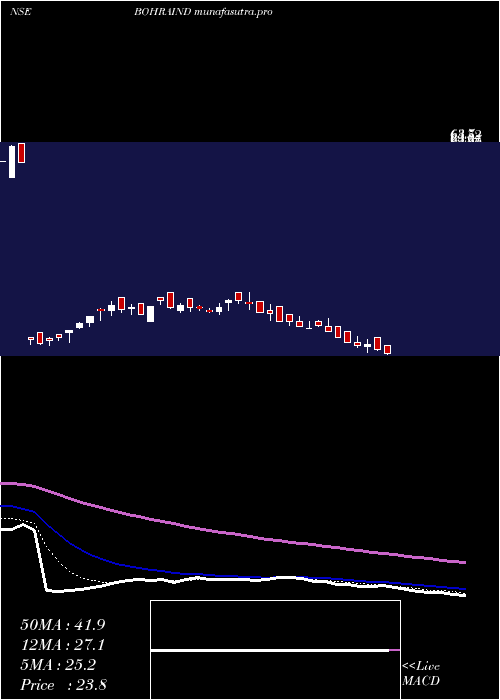
Daily price and volume Bohra Industries
| Date |
Closing |
Open |
Range |
Volume |
Wed 29 October 2025 |
21.13 (-1.12%) |
22.13 |
21.11 - 22.13 |
1.1296 times |
Tue 28 October 2025 |
21.37 (-1.66%) |
21.00 |
21.00 - 22.47 |
1.0444 times |
Mon 27 October 2025 |
21.73 (1.73%) |
22.30 |
21.09 - 22.30 |
1.2545 times |
Fri 24 October 2025 |
21.36 (-0.33%) |
22.23 |
21.00 - 22.23 |
0.8331 times |
Thu 23 October 2025 |
21.43 (-0.83%) |
21.32 |
21.03 - 22.36 |
1.6648 times |
Tue 21 October 2025 |
21.61 (-1.37%) |
22.01 |
20.81 - 22.80 |
0.3585 times |
Mon 20 October 2025 |
21.91 (4.73%) |
21.86 |
20.75 - 21.96 |
0.3095 times |
Fri 17 October 2025 |
20.92 (-3.59%) |
22.49 |
20.82 - 22.49 |
1.5173 times |
Thu 16 October 2025 |
21.70 (-1.41%) |
22.01 |
21.15 - 22.93 |
0.7719 times |
Wed 15 October 2025 |
22.01 (4.31%) |
21.50 |
20.43 - 22.15 |
1.1165 times |
Tue 14 October 2025 |
21.10 (2.63%) |
21.39 |
20.01 - 21.39 |
0.5555 times |
Weekly price and charts BohraIndustries Strong weekly Stock price targets for BohraIndustries BOHRAIND are 20.33 and 21.8 | Weekly Target 1 | 20.06 | | Weekly Target 2 | 20.6 | | Weekly Target 3 | 21.533333333333 | | Weekly Target 4 | 22.07 | | Weekly Target 5 | 23 |
Weekly price and volumes for Bohra Industries
| Date |
Closing |
Open |
Range |
Volume |
Wed 29 October 2025 |
21.13 (-1.08%) |
22.30 |
21.00 - 22.47 |
0.4686 times |
Fri 24 October 2025 |
21.36 (2.1%) |
21.86 |
20.75 - 22.80 |
0.4327 times |
Fri 17 October 2025 |
20.92 (-0.95%) |
21.99 |
20.01 - 22.93 |
0.5975 times |
Fri 10 October 2025 |
21.12 (-6.38%) |
23.44 |
19.85 - 23.44 |
0.7614 times |
Fri 03 October 2025 |
22.56 (-3.38%) |
23.13 |
22.00 - 24.19 |
1.2441 times |
Fri 26 September 2025 |
23.35 (-7.56%) |
25.91 |
23.22 - 26.66 |
1.1628 times |
Fri 19 September 2025 |
25.26 (0.36%) |
25.99 |
24.26 - 26.57 |
0.8269 times |
Fri 12 September 2025 |
25.17 (5.05%) |
23.61 |
23.13 - 26.40 |
1.6782 times |
Fri 05 September 2025 |
23.96 (-7.56%) |
25.92 |
23.02 - 27.21 |
1.7784 times |
Fri 29 August 2025 |
25.92 (-9.65%) |
30.02 |
25.90 - 30.49 |
1.0495 times |
Fri 22 August 2025 |
28.69 (-9.58%) |
32.04 |
28.65 - 33.25 |
1.3915 times |

Monthly price and charts BohraIndustries Strong monthly Stock price targets for BohraIndustries BOHRAIND are 18.52 and 22.47 | Monthly Target 1 | 17.64 | | Monthly Target 2 | 19.39 | | Monthly Target 3 | 21.593333333333 | | Monthly Target 4 | 23.34 | | Monthly Target 5 | 25.54 |
Monthly price and volumes Bohra Industries
| Date |
Closing |
Open |
Range |
Volume |
Wed 29 October 2025 |
21.13 (-7.57%) |
23.80 |
19.85 - 23.80 |
1.3166 times |
Tue 30 September 2025 |
22.86 (-11.81%) |
25.92 |
22.55 - 27.21 |
2.7375 times |
Fri 29 August 2025 |
25.92 (-23.52%) |
35.44 |
25.90 - 35.58 |
2.7213 times |
Thu 31 July 2025 |
33.89 (-58.67%) |
82.05 |
25.32 - 82.05 |
2.9448 times |
Fri 30 June 2023 |
82.00 (-8.89%) |
94.50 |
80.00 - 100.00 |
0.0238 times |
Wed 31 May 2023 |
90.00 (-10.8%) |
105.85 |
81.55 - 105.90 |
0.0297 times |
Fri 28 April 2023 |
100.90 (32.76%) |
76.00 |
71.05 - 110.05 |
0.0438 times |
Fri 31 March 2023 |
76.00 (-30.91%) |
110.00 |
76.00 - 125.30 |
0.0333 times |
Tue 28 February 2023 |
110.00 (-25.88%) |
110.00 |
109.05 - 113.40 |
0.0007 times |
Wed 16 November 2022 |
148.40 (0%) |
116.85 |
116.85 - 148.40 |
0.1486 times |
Wed 29 October 2025 |
(0%) |
|
- |
0 times |

DMA SMA EMA moving averages of Bohra Industries BOHRAIND
DMA (daily moving average) of Bohra Industries BOHRAIND
| DMA period | DMA value | | 5 day DMA | 21.4 | | 12 day DMA | 21.4 | | 20 day DMA | 21.61 | | 35 day DMA | 23.09 | | 50 day DMA | 24.3 | | 100 day DMA | 40.47 | | 150 day DMA | 57.95 | | 200 day DMA | | EMA (exponential moving average) of Bohra Industries BOHRAIND
| EMA period | EMA current | EMA prev | EMA prev2 | | 5 day EMA | 21.38 | 21.5 | 21.56 | | 12 day EMA | 21.56 | 21.64 | 21.69 | | 20 day EMA | 22.06 | 22.16 | 22.24 | | 35 day EMA | 23.29 | 23.42 | 23.54 | | 50 day EMA | 24.74 | 24.89 | 25.03 |
SMA (simple moving average) of Bohra Industries BOHRAIND
| SMA period | SMA current | SMA prev | SMA prev2 | | 5 day SMA | 21.4 | 21.5 | 21.61 | | 12 day SMA | 21.4 | 21.4 | 21.43 | | 20 day SMA | 21.61 | 21.71 | 21.81 | | 35 day SMA | 23.09 | 23.17 | 23.24 | | 50 day SMA | 24.3 | 24.51 | 24.76 | | 100 day SMA | 40.47 | 41.21 | 41.95 | | 150 day SMA | 57.95 | 58.55 | 59.18 | | 200 day SMA |
|
|
