BodalChemicals BODALCHEM full analysis,charts,indicators,moving averages,SMA,DMA,EMA,ADX,MACD,RSIBodal Chemicals BODALCHEM WideScreen charts, DMA,SMA,EMA technical analysis, forecast prediction, by indicators ADX,MACD,RSI,CCI NSE stock exchange
operates under Commodity Chemicals sector
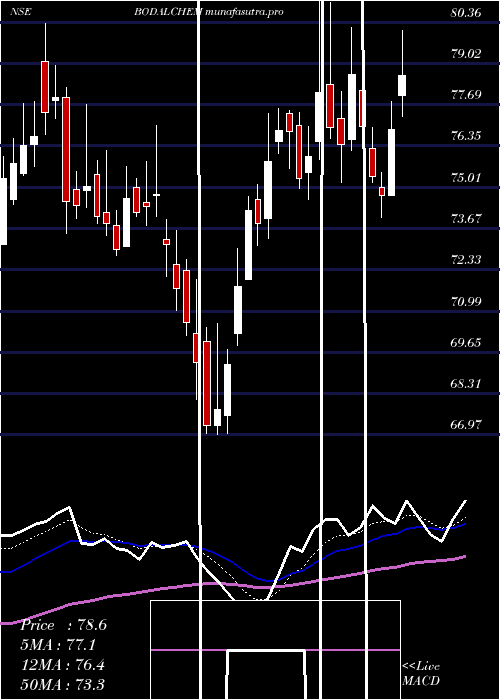
Daily price and charts and targets BodalChemicals Strong Daily Stock price targets for BodalChemicals BODALCHEM are 59.73 and 61.11 | Daily Target 1 | 59.43 | | Daily Target 2 | 60.02 | | Daily Target 3 | 60.806666666667 | | Daily Target 4 | 61.4 | | Daily Target 5 | 62.19 |
Daily price and volume Bodal Chemicals
| Date |
Closing |
Open |
Range |
Volume |
Tue 28 October 2025 |
60.62 (-0.59%) |
61.39 |
60.21 - 61.59 |
0.7063 times |
Mon 27 October 2025 |
60.98 (0.02%) |
61.50 |
60.76 - 61.54 |
1.429 times |
Fri 24 October 2025 |
60.97 (0.4%) |
61.40 |
60.31 - 61.40 |
0.6673 times |
Thu 23 October 2025 |
60.73 (-0.25%) |
61.17 |
60.17 - 61.56 |
1.6666 times |
Tue 21 October 2025 |
60.88 (2.61%) |
60.40 |
59.59 - 61.00 |
0.3564 times |
Mon 20 October 2025 |
59.33 (-0.19%) |
59.83 |
58.59 - 59.90 |
0.8882 times |
Fri 17 October 2025 |
59.44 (-1.34%) |
60.00 |
59.22 - 60.31 |
1.0843 times |
Thu 16 October 2025 |
60.25 (0.7%) |
60.19 |
59.47 - 61.52 |
1.5641 times |
Wed 15 October 2025 |
59.83 (-0.03%) |
60.20 |
59.10 - 60.20 |
0.8049 times |
Tue 14 October 2025 |
59.85 (-1.04%) |
60.00 |
59.50 - 60.99 |
0.8329 times |
Mon 13 October 2025 |
60.48 (-0.18%) |
60.30 |
59.81 - 61.00 |
0.9732 times |
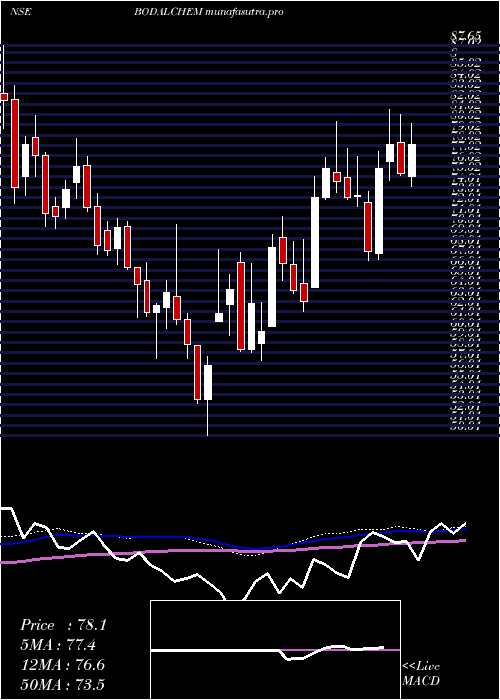
Weekly price and charts BodalChemicals Strong weekly Stock price targets for BodalChemicals BODALCHEM are 59.73 and 61.11 | Weekly Target 1 | 59.43 | | Weekly Target 2 | 60.02 | | Weekly Target 3 | 60.806666666667 | | Weekly Target 4 | 61.4 | | Weekly Target 5 | 62.19 |
Weekly price and volumes for Bodal Chemicals
| Date |
Closing |
Open |
Range |
Volume |
Tue 28 October 2025 |
60.62 (-0.57%) |
61.50 |
60.21 - 61.59 |
0.3599 times |
Fri 24 October 2025 |
60.97 (2.57%) |
59.83 |
58.59 - 61.56 |
0.6031 times |
Fri 17 October 2025 |
59.44 (-1.9%) |
60.30 |
59.10 - 61.52 |
0.8864 times |
Fri 10 October 2025 |
60.59 (-3.55%) |
63.07 |
60.48 - 63.85 |
1.1569 times |
Fri 03 October 2025 |
62.82 (0.03%) |
63.30 |
61.12 - 64.00 |
1.0452 times |
Fri 26 September 2025 |
62.80 (-5.09%) |
66.43 |
61.66 - 67.20 |
1.2564 times |
Fri 19 September 2025 |
66.17 (0.99%) |
65.77 |
65.30 - 67.75 |
1.0792 times |
Fri 12 September 2025 |
65.52 (0.58%) |
65.43 |
64.00 - 67.20 |
1.2101 times |
Fri 05 September 2025 |
65.14 (0.73%) |
65.15 |
63.70 - 66.87 |
1.2821 times |
Fri 29 August 2025 |
64.67 (-3.13%) |
67.19 |
64.01 - 67.20 |
1.1206 times |
Fri 22 August 2025 |
66.76 (1.38%) |
66.90 |
66.04 - 69.20 |
1.9013 times |
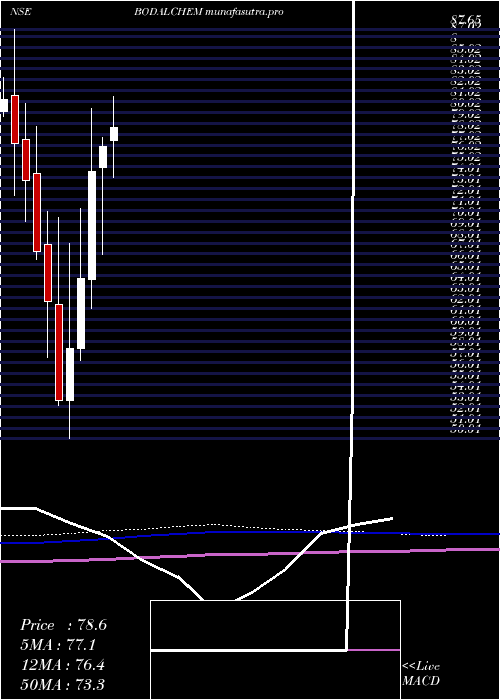
Monthly price and charts BodalChemicals Strong monthly Stock price targets for BodalChemicals BODALCHEM are 56.98 and 62.24 | Monthly Target 1 | 55.76 | | Monthly Target 2 | 58.19 | | Monthly Target 3 | 61.02 | | Monthly Target 4 | 63.45 | | Monthly Target 5 | 66.28 |
Monthly price and volumes Bodal Chemicals
| Date |
Closing |
Open |
Range |
Volume |
Tue 28 October 2025 |
60.62 (-1.8%) |
62.00 |
58.59 - 63.85 |
0.3316 times |
Tue 30 September 2025 |
61.73 (-4.55%) |
65.15 |
61.25 - 67.75 |
0.518 times |
Fri 29 August 2025 |
64.67 (-13.62%) |
73.75 |
64.01 - 76.00 |
0.924 times |
Thu 31 July 2025 |
74.87 (-2.59%) |
77.40 |
72.70 - 81.49 |
1.4963 times |
Mon 30 June 2025 |
76.86 (3.1%) |
74.92 |
66.97 - 77.70 |
0.8844 times |
Fri 30 May 2025 |
74.55 (15.1%) |
64.70 |
62.01 - 80.33 |
1.3091 times |
Wed 30 April 2025 |
64.77 (10.96%) |
58.35 |
57.26 - 71.15 |
1.0277 times |
Fri 28 March 2025 |
58.37 (9.08%) |
53.54 |
50.01 - 68.00 |
2.2669 times |
Fri 28 February 2025 |
53.51 (-14.52%) |
62.37 |
53.10 - 70.36 |
0.6981 times |
Fri 31 January 2025 |
62.60 (-6.89%) |
67.87 |
57.50 - 70.95 |
0.5439 times |
Tue 31 December 2024 |
67.23 (-8.88%) |
74.45 |
66.51 - 78.70 |
0.7928 times |
DMA SMA EMA moving averages of Bodal Chemicals BODALCHEM
DMA (daily moving average) of Bodal Chemicals BODALCHEM
| DMA period | DMA value | | 5 day DMA | 60.84 | | 12 day DMA | 60.33 | | 20 day DMA | 60.9 | | 35 day DMA | 62.9 | | 50 day DMA | 63.84 | | 100 day DMA | 68.77 | | 150 day DMA | 68.54 | | 200 day DMA | 66.78 | EMA (exponential moving average) of Bodal Chemicals BODALCHEM
| EMA period | EMA current | EMA prev | EMA prev2 | | 5 day EMA | 60.67 | 60.69 | 60.55 | | 12 day EMA | 60.76 | 60.78 | 60.74 | | 20 day EMA | 61.31 | 61.38 | 61.42 | | 35 day EMA | 62.44 | 62.55 | 62.64 | | 50 day EMA | 63.89 | 64.02 | 64.14 |
SMA (simple moving average) of Bodal Chemicals BODALCHEM
| SMA period | SMA current | SMA prev | SMA prev2 | | 5 day SMA | 60.84 | 60.58 | 60.27 | | 12 day SMA | 60.33 | 60.34 | 60.35 | | 20 day SMA | 60.9 | 61.01 | 61.15 | | 35 day SMA | 62.9 | 63.03 | 63.15 | | 50 day SMA | 63.84 | 63.95 | 64.12 | | 100 day SMA | 68.77 | 68.91 | 69.05 | | 150 day SMA | 68.54 | 68.57 | 68.56 | | 200 day SMA | 66.78 | 66.81 | 66.86 |
|
|
