BluePebble BLUEPEBBLE_SM full analysis,charts,indicators,moving averages,SMA,DMA,EMA,ADX,MACD,RSIBlue Pebble BLUEPEBBLE_SM WideScreen charts, DMA,SMA,EMA technical analysis, forecast prediction, by indicators ADX,MACD,RSI,CCI NSE stock exchange
Daily price and charts and targets BluePebble Strong Daily Stock price targets for BluePebble BLUEPEBBLE_SM are 150.7 and 157.3 | Daily Target 1 | 149.4 | | Daily Target 2 | 152 | | Daily Target 3 | 156 | | Daily Target 4 | 158.6 | | Daily Target 5 | 162.6 |
Daily price and volume Blue Pebble
| Date |
Closing |
Open |
Range |
Volume |
Mon 27 October 2025 |
154.60 (-4.06%) |
160.00 |
153.40 - 160.00 |
1.8692 times |
Fri 24 October 2025 |
161.15 (-0.06%) |
164.85 |
159.05 - 164.85 |
0.9346 times |
Thu 23 October 2025 |
161.25 (-4.02%) |
164.05 |
161.00 - 165.00 |
1.215 times |
Tue 21 October 2025 |
168.00 (2.44%) |
165.00 |
164.00 - 168.00 |
0.5607 times |
Mon 20 October 2025 |
164.00 (-0.18%) |
164.30 |
164.00 - 165.00 |
0.4673 times |
Fri 17 October 2025 |
164.30 (-2.2%) |
163.25 |
162.05 - 166.50 |
1.4019 times |
Thu 16 October 2025 |
168.00 (0.3%) |
170.00 |
168.00 - 170.00 |
0.2804 times |
Wed 15 October 2025 |
167.50 (-0.24%) |
162.35 |
160.60 - 169.80 |
1.215 times |
Tue 14 October 2025 |
167.90 (-0.06%) |
167.85 |
167.85 - 167.90 |
0.1869 times |
Mon 13 October 2025 |
168.00 (-1.41%) |
150.05 |
150.00 - 171.80 |
1.8692 times |
Fri 10 October 2025 |
170.40 (-1.98%) |
171.00 |
168.00 - 172.60 |
0.8411 times |
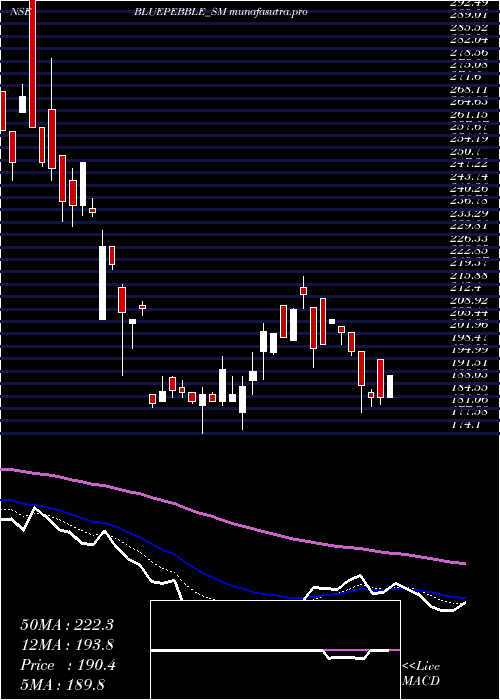
Weekly price and charts BluePebble Strong weekly Stock price targets for BluePebble BLUEPEBBLE_SM are 150.7 and 157.3 | Weekly Target 1 | 149.4 | | Weekly Target 2 | 152 | | Weekly Target 3 | 156 | | Weekly Target 4 | 158.6 | | Weekly Target 5 | 162.6 |
Weekly price and volumes for Blue Pebble
| Date |
Closing |
Open |
Range |
Volume |
Mon 27 October 2025 |
154.60 (-4.06%) |
160.00 |
153.40 - 160.00 |
0.3591 times |
Fri 24 October 2025 |
161.15 (-1.92%) |
164.30 |
159.05 - 168.00 |
0.6104 times |
Fri 17 October 2025 |
164.30 (-3.58%) |
150.05 |
150.00 - 171.80 |
0.9515 times |
Fri 10 October 2025 |
170.40 (-1.96%) |
168.15 |
168.00 - 173.85 |
0.6822 times |
Fri 03 October 2025 |
173.80 (-0.29%) |
175.70 |
170.10 - 177.90 |
0.7002 times |
Fri 26 September 2025 |
174.30 (-3.3%) |
175.00 |
170.00 - 180.00 |
1.3465 times |
Fri 19 September 2025 |
180.25 (-2.25%) |
188.80 |
176.10 - 195.00 |
0.8079 times |
Fri 12 September 2025 |
184.40 (7.84%) |
171.00 |
171.00 - 189.50 |
1.3824 times |
Fri 05 September 2025 |
171.00 (-0.96%) |
174.00 |
167.20 - 194.50 |
2.4057 times |
Fri 29 August 2025 |
172.65 (-4.24%) |
185.05 |
171.05 - 186.00 |
0.754 times |
Fri 22 August 2025 |
180.30 (3.62%) |
178.05 |
175.00 - 201.00 |
1.6338 times |
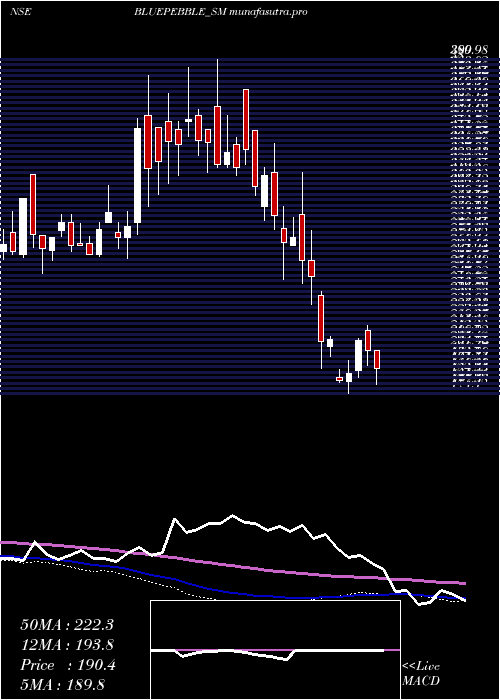
Monthly price and charts BluePebble Strong monthly Stock price targets for BluePebble BLUEPEBBLE_SM are 140 and 164.6 | Monthly Target 1 | 135.13 | | Monthly Target 2 | 144.87 | | Monthly Target 3 | 159.73333333333 | | Monthly Target 4 | 169.47 | | Monthly Target 5 | 184.33 |
Monthly price and volumes Blue Pebble
| Date |
Closing |
Open |
Range |
Volume |
Mon 27 October 2025 |
154.60 (-11.15%) |
174.00 |
150.00 - 174.60 |
0.413 times |
Tue 30 September 2025 |
174.00 (0.78%) |
174.00 |
167.20 - 195.00 |
0.9505 times |
Fri 29 August 2025 |
172.65 (-5.19%) |
175.05 |
167.50 - 201.00 |
0.6089 times |
Thu 31 July 2025 |
182.10 (-14.51%) |
209.50 |
180.00 - 212.00 |
0.7387 times |
Mon 30 June 2025 |
213.00 (1.91%) |
185.00 |
174.10 - 218.00 |
0.8525 times |
Tue 04 March 2025 |
209.00 (0.5%) |
205.00 |
198.00 - 211.00 |
0.0794 times |
Fri 28 February 2025 |
207.95 (-23.55%) |
270.00 |
190.30 - 317.00 |
0.8102 times |
Fri 31 January 2025 |
272.00 (-19.05%) |
340.00 |
248.00 - 349.00 |
1.4853 times |
Tue 31 December 2024 |
336.00 (-0.59%) |
345.00 |
315.00 - 390.00 |
1.6256 times |
Fri 29 November 2024 |
338.00 (6.81%) |
320.00 |
310.00 - 385.00 |
2.4358 times |
Thu 31 October 2024 |
316.45 (14.37%) |
274.50 |
261.20 - 379.65 |
3.8337 times |
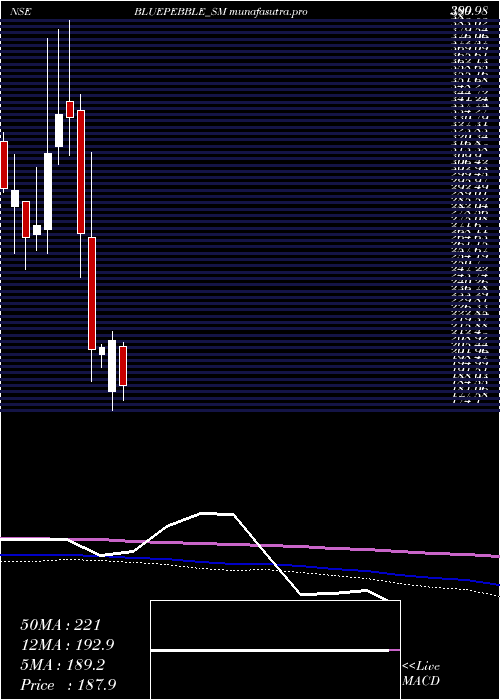
DMA SMA EMA moving averages of Blue Pebble BLUEPEBBLE_SM
DMA (daily moving average) of Blue Pebble BLUEPEBBLE_SM
| DMA period | DMA value | | 5 day DMA | 161.8 | | 12 day DMA | 165.75 | | 20 day DMA | 168.74 | | 35 day DMA | 173.05 | | 50 day DMA | 174.49 | | 100 day DMA | 184.06 | | 150 day DMA | 221.57 | | 200 day DMA | 246.89 | EMA (exponential moving average) of Blue Pebble BLUEPEBBLE_SM
| EMA period | EMA current | EMA prev | EMA prev2 | | 5 day EMA | 160.64 | 163.66 | 164.91 | | 12 day EMA | 164.75 | 166.6 | 167.59 | | 20 day EMA | 167.67 | 169.04 | 169.87 | | 35 day EMA | 170.87 | 171.83 | 172.46 | | 50 day EMA | 173.88 | 174.67 | 175.22 |
SMA (simple moving average) of Blue Pebble BLUEPEBBLE_SM
| SMA period | SMA current | SMA prev | SMA prev2 | | 5 day SMA | 161.8 | 163.74 | 165.11 | | 12 day SMA | 165.75 | 166.98 | 167.88 | | 20 day SMA | 168.74 | 169.8 | 170.66 | | 35 day SMA | 173.05 | 173.85 | 174.41 | | 50 day SMA | 174.49 | 175.09 | 175.55 | | 100 day SMA | 184.06 | 185.01 | 185.78 | | 150 day SMA | 221.57 | 222.72 | 223.89 | | 200 day SMA | 246.89 | 247.5 | 248.15 |
|
|
