BlueJet BLUEJET full analysis,charts,indicators,moving averages,SMA,DMA,EMA,ADX,MACD,RSIBlue Jet BLUEJET WideScreen charts, DMA,SMA,EMA technical analysis, forecast prediction, by indicators ADX,MACD,RSI,CCI NSE stock exchange
Daily price and charts and targets BlueJet Strong Daily Stock price targets for BlueJet BLUEJET are 631.4 and 643.4 | Daily Target 1 | 628.93 | | Daily Target 2 | 633.87 | | Daily Target 3 | 640.93333333333 | | Daily Target 4 | 645.87 | | Daily Target 5 | 652.93 |
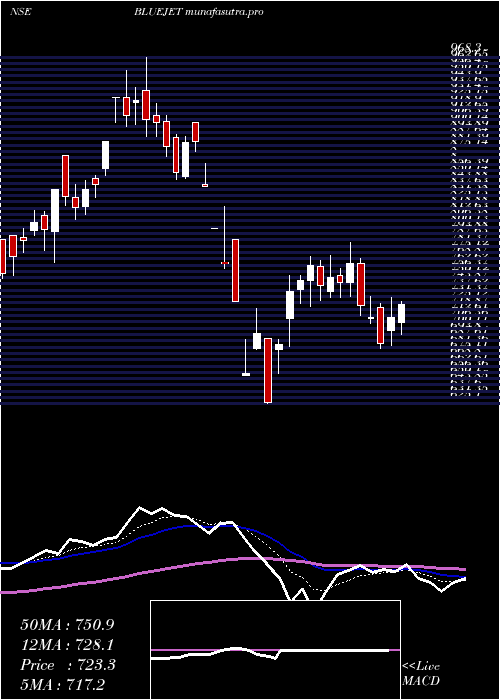
Daily price and volume Blue Jet
| Date |
Closing |
Open |
Range |
Volume |
Tue 28 October 2025 |
638.80 (0.55%) |
641.90 |
636.00 - 648.00 |
1.153 times |
Mon 27 October 2025 |
635.30 (-1.46%) |
650.00 |
632.40 - 650.00 |
0.9303 times |
Fri 24 October 2025 |
644.70 (-0.97%) |
658.65 |
643.05 - 658.65 |
0.9207 times |
Thu 23 October 2025 |
651.00 (-1.78%) |
671.00 |
648.00 - 673.35 |
1.2629 times |
Tue 21 October 2025 |
662.80 (0.25%) |
665.00 |
660.20 - 668.00 |
0.3213 times |
Mon 20 October 2025 |
661.15 (1.2%) |
665.00 |
650.60 - 665.00 |
1.0533 times |
Fri 17 October 2025 |
653.30 (-2.71%) |
670.00 |
652.00 - 674.80 |
1.2218 times |
Thu 16 October 2025 |
671.50 (1.46%) |
665.00 |
661.10 - 679.95 |
1.2133 times |
Wed 15 October 2025 |
661.85 (0.72%) |
657.05 |
655.00 - 670.45 |
0.7732 times |
Tue 14 October 2025 |
657.10 (-1.02%) |
664.40 |
654.10 - 666.05 |
1.1502 times |
Mon 13 October 2025 |
663.85 (-2.06%) |
671.00 |
657.50 - 684.90 |
2.2078 times |
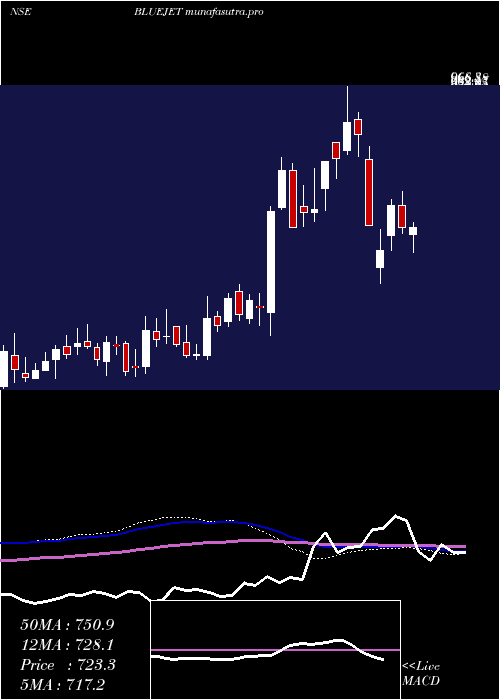
Weekly price and charts BlueJet Strong weekly Stock price targets for BlueJet BLUEJET are 626.8 and 644.4 | Weekly Target 1 | 622.8 | | Weekly Target 2 | 630.8 | | Weekly Target 3 | 640.4 | | Weekly Target 4 | 648.4 | | Weekly Target 5 | 658 |
Weekly price and volumes for Blue Jet
| Date |
Closing |
Open |
Range |
Volume |
Tue 28 October 2025 |
638.80 (-0.92%) |
650.00 |
632.40 - 650.00 |
0.1738 times |
Fri 24 October 2025 |
644.70 (-1.32%) |
665.00 |
643.05 - 673.35 |
0.2969 times |
Fri 17 October 2025 |
653.30 (-3.61%) |
671.00 |
652.00 - 684.90 |
0.5479 times |
Fri 10 October 2025 |
677.80 (2.18%) |
668.85 |
650.95 - 692.90 |
0.8622 times |
Fri 03 October 2025 |
663.35 (2.7%) |
646.95 |
628.40 - 684.00 |
0.7603 times |
Fri 26 September 2025 |
645.90 (-4.94%) |
680.00 |
633.35 - 691.85 |
0.8915 times |
Fri 19 September 2025 |
679.45 (-5.23%) |
716.55 |
671.85 - 721.00 |
1.5037 times |
Fri 12 September 2025 |
716.95 (-3.6%) |
743.75 |
681.30 - 759.50 |
2.6899 times |
Fri 05 September 2025 |
743.75 (11.36%) |
667.90 |
646.50 - 743.75 |
1.1979 times |
Fri 29 August 2025 |
667.85 (-13.86%) |
745.55 |
659.95 - 761.45 |
1.0759 times |
Fri 22 August 2025 |
775.35 (-1.71%) |
791.95 |
765.70 - 792.00 |
0.3794 times |
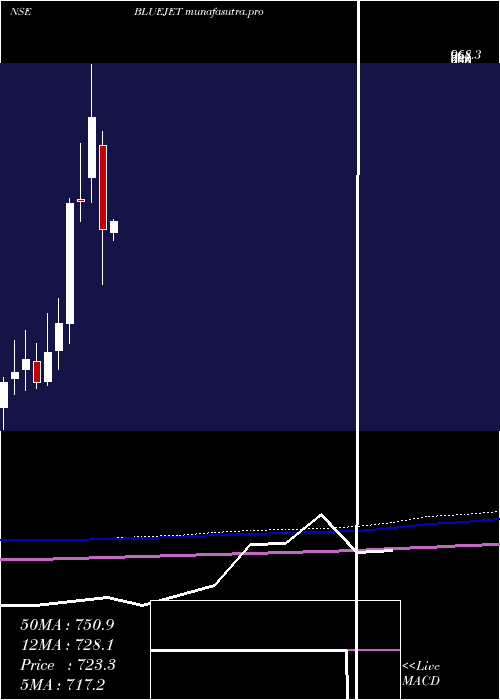
Monthly price and charts BlueJet Strong monthly Stock price targets for BlueJet BLUEJET are 634.48 and 697.23 | Monthly Target 1 | 591.2 | | Monthly Target 2 | 615 | | Monthly Target 3 | 653.95 | | Monthly Target 4 | 677.75 | | Monthly Target 5 | 716.7 |
Monthly price and volumes Blue Jet
| Date |
Closing |
Open |
Range |
Volume |
Tue 28 October 2025 |
638.80 (1.37%) |
638.70 |
630.15 - 692.90 |
0.5492 times |
Tue 30 September 2025 |
630.15 (-5.64%) |
667.90 |
628.40 - 759.50 |
1.6498 times |
Fri 29 August 2025 |
667.85 (-17.14%) |
808.00 |
659.95 - 825.00 |
0.7765 times |
Thu 31 July 2025 |
805.95 (-8.18%) |
879.90 |
755.10 - 1027.80 |
1.8263 times |
Mon 30 June 2025 |
877.75 (-2.99%) |
900.00 |
847.50 - 986.00 |
0.6139 times |
Fri 30 May 2025 |
904.80 (27.23%) |
706.15 |
692.05 - 909.90 |
1.1016 times |
Wed 30 April 2025 |
711.15 (-19.63%) |
842.20 |
625.10 - 863.45 |
0.9638 times |
Fri 28 March 2025 |
884.85 (17.35%) |
791.70 |
752.55 - 968.30 |
0.6939 times |
Fri 28 February 2025 |
754.00 (0.47%) |
758.00 |
723.20 - 844.80 |
0.9399 times |
Fri 31 January 2025 |
750.45 (32.89%) |
564.70 |
534.00 - 758.80 |
0.8852 times |
Tue 31 December 2024 |
564.70 (8.72%) |
522.65 |
492.00 - 603.00 |
0.7035 times |
DMA SMA EMA moving averages of Blue Jet BLUEJET
DMA (daily moving average) of Blue Jet BLUEJET
| DMA period | DMA value | | 5 day DMA | 646.52 | | 12 day DMA | 656.6 | | 20 day DMA | 657.39 | | 35 day DMA | 672.13 | | 50 day DMA | 689.81 | | 100 day DMA | 780.84 | | 150 day DMA | 783.53 | | 200 day DMA | 769.3 | EMA (exponential moving average) of Blue Jet BLUEJET
| EMA period | EMA current | EMA prev | EMA prev2 | | 5 day EMA | 644.66 | 647.59 | 653.73 | | 12 day EMA | 652.86 | 655.41 | 659.06 | | 20 day EMA | 660.18 | 662.43 | 665.29 | | 35 day EMA | 677.21 | 679.47 | 682.07 | | 50 day EMA | 693.67 | 695.91 | 698.38 |
SMA (simple moving average) of Blue Jet BLUEJET
| SMA period | SMA current | SMA prev | SMA prev2 | | 5 day SMA | 646.52 | 650.99 | 654.59 | | 12 day SMA | 656.6 | 657.82 | 660.18 | | 20 day SMA | 657.39 | 657.74 | 659.22 | | 35 day SMA | 672.13 | 675.13 | 677.22 | | 50 day SMA | 689.81 | 692.87 | 695.7 | | 100 day SMA | 780.84 | 783.53 | 786.04 | | 150 day SMA | 783.53 | 785.34 | 787.3 | | 200 day SMA | 769.3 | 768.98 | 768.8 |
|
|
