BemlLand BLAL full analysis,charts,indicators,moving averages,SMA,DMA,EMA,ADX,MACD,RSIBeml Land BLAL WideScreen charts, DMA,SMA,EMA technical analysis, forecast prediction, by indicators ADX,MACD,RSI,CCI NSE stock exchange
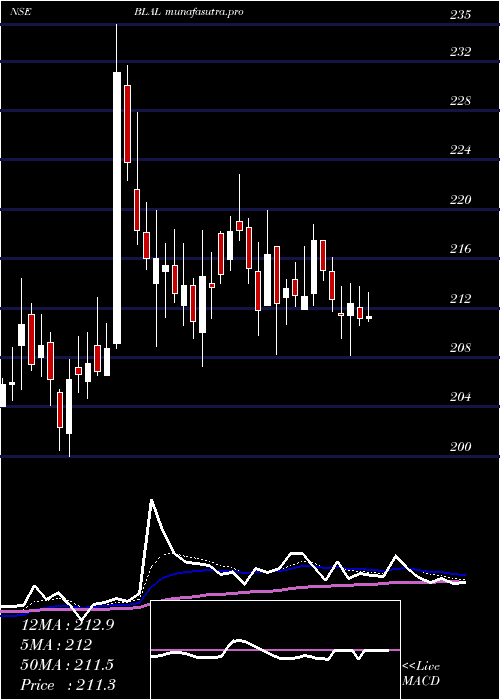
Daily price and charts and targets BemlLand Strong Daily Stock price targets for BemlLand BLAL are 208.91 and 211.3 | Daily Target 1 | 207.18 | | Daily Target 2 | 208.25 | | Daily Target 3 | 209.57 | | Daily Target 4 | 210.64 | | Daily Target 5 | 211.96 |
Daily price and volume Beml Land
| Date |
Closing |
Open |
Range |
Volume |
Wed 29 October 2025 |
209.32 (-0.32%) |
208.50 |
208.50 - 210.89 |
1.2446 times |
Tue 28 October 2025 |
210.00 (0.37%) |
210.25 |
208.48 - 211.00 |
1.4165 times |
Mon 27 October 2025 |
209.22 (-1.31%) |
214.00 |
208.60 - 214.00 |
1.098 times |
Fri 24 October 2025 |
212.00 (1.56%) |
210.50 |
207.99 - 214.18 |
1.7828 times |
Thu 23 October 2025 |
208.74 (-0.79%) |
211.80 |
208.01 - 211.80 |
1.0396 times |
Tue 21 October 2025 |
210.41 (-0.01%) |
210.00 |
208.64 - 211.90 |
0.4212 times |
Mon 20 October 2025 |
210.44 (0.67%) |
209.04 |
208.56 - 214.40 |
1.1842 times |
Fri 17 October 2025 |
209.04 (-0.04%) |
208.01 |
208.01 - 209.94 |
0.3632 times |
Thu 16 October 2025 |
209.13 (1.24%) |
206.50 |
206.50 - 210.70 |
0.6367 times |
Wed 15 October 2025 |
206.57 (0.06%) |
206.45 |
206.00 - 208.47 |
0.8132 times |
Tue 14 October 2025 |
206.45 (-1.84%) |
210.55 |
206.00 - 211.00 |
1.2027 times |
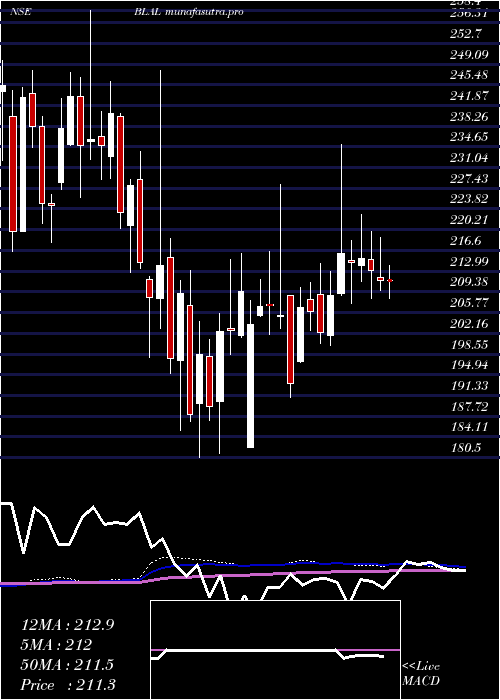
Weekly price and charts BemlLand Strong weekly Stock price targets for BemlLand BLAL are 206.14 and 211.66 | Weekly Target 1 | 205.08 | | Weekly Target 2 | 207.2 | | Weekly Target 3 | 210.6 | | Weekly Target 4 | 212.72 | | Weekly Target 5 | 216.12 |
Weekly price and volumes for Beml Land
| Date |
Closing |
Open |
Range |
Volume |
Wed 29 October 2025 |
209.32 (-1.26%) |
214.00 |
208.48 - 214.00 |
0.2743 times |
Fri 24 October 2025 |
212.00 (1.42%) |
209.04 |
207.99 - 214.40 |
0.3231 times |
Fri 17 October 2025 |
209.04 (-0.55%) |
209.14 |
206.00 - 211.58 |
0.2735 times |
Fri 10 October 2025 |
210.19 (-1.48%) |
213.10 |
207.99 - 213.58 |
0.6105 times |
Fri 03 October 2025 |
213.35 (0.23%) |
211.38 |
211.21 - 221.21 |
0.9307 times |
Fri 26 September 2025 |
212.85 (-3.71%) |
219.02 |
210.95 - 223.97 |
0.6171 times |
Fri 19 September 2025 |
221.04 (-2.98%) |
227.84 |
220.14 - 229.65 |
0.8104 times |
Fri 12 September 2025 |
227.84 (0.73%) |
226.18 |
225.01 - 233.80 |
1.3372 times |
Fri 05 September 2025 |
226.18 (8.9%) |
209.79 |
207.11 - 231.90 |
3.9408 times |
Fri 29 August 2025 |
207.70 (-0.39%) |
209.21 |
206.50 - 218.80 |
0.8825 times |
Fri 22 August 2025 |
208.52 (2.37%) |
206.00 |
203.15 - 211.38 |
0.5383 times |
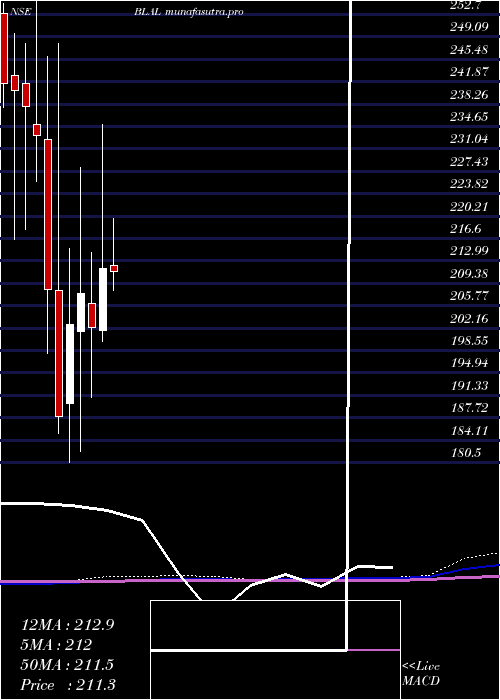
Monthly price and charts BemlLand Strong monthly Stock price targets for BemlLand BLAL are 200.06 and 215.27 | Monthly Target 1 | 196.97 | | Monthly Target 2 | 203.14 | | Monthly Target 3 | 212.17666666667 | | Monthly Target 4 | 218.35 | | Monthly Target 5 | 227.39 |
Monthly price and volumes Beml Land
| Date |
Closing |
Open |
Range |
Volume |
Wed 29 October 2025 |
209.32 (-2.83%) |
215.41 |
206.00 - 221.21 |
0.3337 times |
Tue 30 September 2025 |
215.41 (3.71%) |
209.79 |
207.11 - 233.80 |
1.0498 times |
Fri 29 August 2025 |
207.70 (-0.52%) |
208.50 |
199.00 - 218.80 |
0.4781 times |
Thu 31 July 2025 |
208.78 (-1.44%) |
212.25 |
207.29 - 219.86 |
0.6789 times |
Mon 30 June 2025 |
211.83 (4.7%) |
201.80 |
200.00 - 235.00 |
1.62 times |
Fri 30 May 2025 |
202.33 (-2.59%) |
206.10 |
191.01 - 214.39 |
1.1742 times |
Wed 30 April 2025 |
207.72 (2.48%) |
201.70 |
182.26 - 228.00 |
1.0238 times |
Fri 28 March 2025 |
202.69 (7.84%) |
190.00 |
180.50 - 215.00 |
1.3829 times |
Fri 28 February 2025 |
187.95 (-9.83%) |
208.20 |
185.15 - 248.00 |
1.4054 times |
Fri 31 January 2025 |
208.44 (-10.62%) |
232.50 |
198.00 - 246.00 |
0.8531 times |
Tue 31 December 2024 |
233.21 (-1.96%) |
235.00 |
225.75 - 258.40 |
1.1497 times |
DMA SMA EMA moving averages of Beml Land BLAL
DMA (daily moving average) of Beml Land BLAL
| DMA period | DMA value | | 5 day DMA | 209.86 | | 12 day DMA | 209.3 | | 20 day DMA | 210.35 | | 35 day DMA | 215.48 | | 50 day DMA | 214.87 | | 100 day DMA | 213.44 | | 150 day DMA | 210.61 | | 200 day DMA | 209.81 | EMA (exponential moving average) of Beml Land BLAL
| EMA period | EMA current | EMA prev | EMA prev2 | | 5 day EMA | 209.73 | 209.93 | 209.89 | | 12 day EMA | 210.06 | 210.2 | 210.24 | | 20 day EMA | 210.97 | 211.14 | 211.26 | | 35 day EMA | 211.79 | 211.94 | 212.05 | | 50 day EMA | 213.29 | 213.45 | 213.59 |
SMA (simple moving average) of Beml Land BLAL
| SMA period | SMA current | SMA prev | SMA prev2 | | 5 day SMA | 209.86 | 210.07 | 210.16 | | 12 day SMA | 209.3 | 209.38 | 209.27 | | 20 day SMA | 210.35 | 210.58 | 210.72 | | 35 day SMA | 215.48 | 215.99 | 216.45 | | 50 day SMA | 214.87 | 214.76 | 214.56 | | 100 day SMA | 213.44 | 213.41 | 213.39 | | 150 day SMA | 210.61 | 210.56 | 210.49 | | 200 day SMA | 209.81 | 209.95 | 210.07 |
|
|
