BirlaCable BIRLACABLE full analysis,charts,indicators,moving averages,SMA,DMA,EMA,ADX,MACD,RSIBirla Cable BIRLACABLE WideScreen charts, DMA,SMA,EMA technical analysis, forecast prediction, by indicators ADX,MACD,RSI,CCI NSE stock exchange
operates under Other Elect.Equip. sector
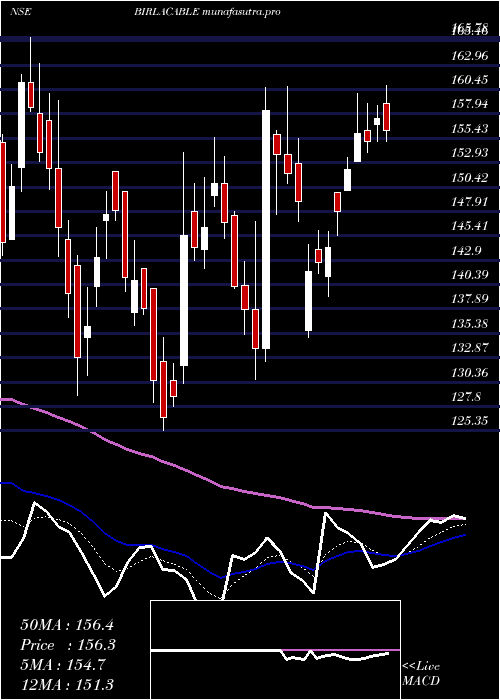
Daily price and charts and targets BirlaCable Strong Daily Stock price targets for BirlaCable BIRLACABLE are 155.67 and 157.17 | Daily Target 1 | 155.38 | | Daily Target 2 | 155.95 | | Daily Target 3 | 156.87666666667 | | Daily Target 4 | 157.45 | | Daily Target 5 | 158.38 |
Daily price and volume Birla Cable
| Date |
Closing |
Open |
Range |
Volume |
Tue 28 October 2025 |
156.53 (0.71%) |
157.80 |
156.30 - 157.80 |
0.4055 times |
Mon 27 October 2025 |
155.43 (-0.12%) |
155.70 |
155.00 - 159.90 |
1.2673 times |
Fri 24 October 2025 |
155.62 (-1.82%) |
156.20 |
155.00 - 158.39 |
1.2653 times |
Thu 23 October 2025 |
158.51 (2.1%) |
155.25 |
155.25 - 160.00 |
1.4983 times |
Tue 21 October 2025 |
155.25 (0.39%) |
159.20 |
152.81 - 159.20 |
0.5543 times |
Mon 20 October 2025 |
154.65 (0.04%) |
153.01 |
153.01 - 157.00 |
0.5743 times |
Fri 17 October 2025 |
154.59 (-0.74%) |
153.20 |
153.20 - 157.89 |
0.6731 times |
Thu 16 October 2025 |
155.75 (-2.07%) |
158.99 |
155.10 - 159.73 |
0.7523 times |
Wed 15 October 2025 |
159.04 (2.97%) |
155.79 |
151.01 - 160.35 |
1.8134 times |
Tue 14 October 2025 |
154.45 (-1.2%) |
157.12 |
152.21 - 157.53 |
1.1963 times |
Mon 13 October 2025 |
156.33 (-0.85%) |
157.67 |
155.42 - 157.67 |
0.6947 times |
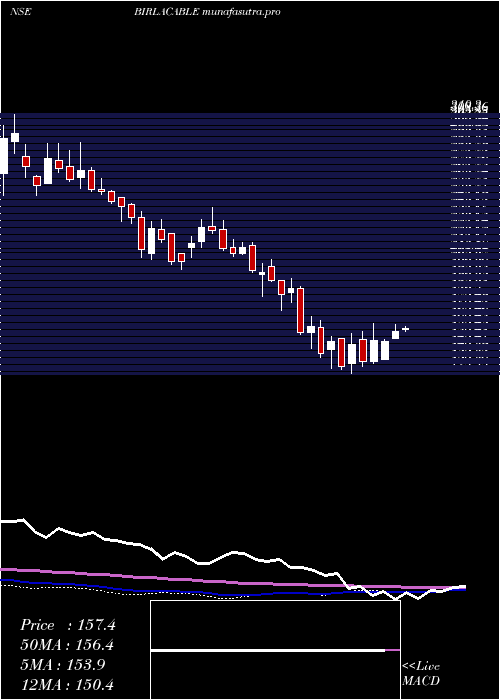
Weekly price and charts BirlaCable Strong weekly Stock price targets for BirlaCable BIRLACABLE are 155.77 and 160.67 | Weekly Target 1 | 152.24 | | Weekly Target 2 | 154.39 | | Weekly Target 3 | 157.14333333333 | | Weekly Target 4 | 159.29 | | Weekly Target 5 | 162.04 |
Weekly price and volumes for Birla Cable
| Date |
Closing |
Open |
Range |
Volume |
Tue 28 October 2025 |
156.53 (0.58%) |
155.70 |
155.00 - 159.90 |
0.0302 times |
Fri 24 October 2025 |
155.62 (0.67%) |
153.01 |
152.81 - 160.00 |
0.0702 times |
Fri 17 October 2025 |
154.59 (-1.95%) |
157.67 |
151.01 - 160.35 |
0.0925 times |
Fri 10 October 2025 |
157.67 (-2.62%) |
162.80 |
156.74 - 169.00 |
0.1614 times |
Fri 03 October 2025 |
161.91 (3.5%) |
156.00 |
155.65 - 165.20 |
0.0868 times |
Fri 26 September 2025 |
156.44 (-15.69%) |
178.30 |
155.20 - 178.70 |
0.2571 times |
Thu 19 June 2025 |
185.55 (3.29%) |
177.05 |
175.80 - 215.20 |
7.5695 times |
Fri 13 June 2025 |
179.64 (-1%) |
181.45 |
174.67 - 192.01 |
0.58 times |
Fri 06 June 2025 |
181.45 (-0.29%) |
181.97 |
179.25 - 193.60 |
0.5295 times |
Fri 30 May 2025 |
181.97 (-5.01%) |
191.25 |
180.13 - 194.70 |
0.623 times |
Fri 23 May 2025 |
191.56 (13.93%) |
169.90 |
165.79 - 202.00 |
3.305 times |
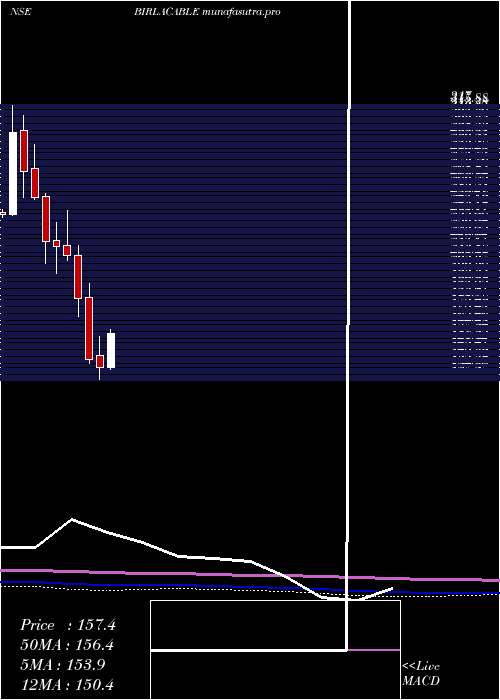
Monthly price and charts BirlaCable Strong monthly Stock price targets for BirlaCable BIRLACABLE are 144.78 and 162.77 | Monthly Target 1 | 140.86 | | Monthly Target 2 | 148.69 | | Monthly Target 3 | 158.84666666667 | | Monthly Target 4 | 166.68 | | Monthly Target 5 | 176.84 |
Monthly price and volumes Birla Cable
| Date |
Closing |
Open |
Range |
Volume |
Tue 28 October 2025 |
156.53 (-1.57%) |
159.00 |
151.01 - 169.00 |
0.1558 times |
Tue 30 September 2025 |
159.02 (-14.3%) |
178.30 |
155.20 - 178.70 |
0.115 times |
Thu 19 June 2025 |
185.55 (1.97%) |
181.97 |
174.67 - 215.20 |
3.3659 times |
Fri 30 May 2025 |
181.97 (23.33%) |
147.55 |
138.20 - 202.00 |
2.0686 times |
Wed 30 April 2025 |
147.55 (10.21%) |
133.88 |
132.51 - 166.58 |
1.9588 times |
Fri 28 March 2025 |
133.88 (-3.99%) |
142.40 |
125.35 - 155.49 |
0.942 times |
Fri 28 February 2025 |
139.45 (-23.38%) |
182.85 |
137.00 - 192.84 |
0.2929 times |
Fri 31 January 2025 |
182.00 (-14.29%) |
212.30 |
170.01 - 219.00 |
0.2929 times |
Tue 31 December 2024 |
212.35 (-2.74%) |
219.30 |
209.02 - 243.95 |
0.4971 times |
Fri 29 November 2024 |
218.34 (-1.83%) |
222.85 |
199.60 - 235.40 |
0.3111 times |
Thu 31 October 2024 |
222.40 (-12.01%) |
253.40 |
207.00 - 255.70 |
0.3923 times |
DMA SMA EMA moving averages of Birla Cable BIRLACABLE
DMA (daily moving average) of Birla Cable BIRLACABLE
| DMA period | DMA value | | 5 day DMA | 156.27 | | 12 day DMA | 156.15 | | 20 day DMA | 157.66 | | 35 day DMA | 167.3 | | 50 day DMA | 171.21 | | 100 day DMA | 158.86 | | 150 day DMA | 169.34 | | 200 day DMA | 183.24 | EMA (exponential moving average) of Birla Cable BIRLACABLE
| EMA period | EMA current | EMA prev | EMA prev2 | | 5 day EMA | 156.15 | 155.96 | 156.22 | | 12 day EMA | 157.11 | 157.22 | 157.55 | | 20 day EMA | 159.42 | 159.72 | 160.17 | | 35 day EMA | 163.21 | 163.6 | 164.08 | | 50 day EMA | 168.15 | 168.62 | 169.16 |
SMA (simple moving average) of Birla Cable BIRLACABLE
| SMA period | SMA current | SMA prev | SMA prev2 | | 5 day SMA | 156.27 | 155.89 | 155.72 | | 12 day SMA | 156.15 | 156.22 | 156.46 | | 20 day SMA | 157.66 | 157.66 | 158.07 | | 35 day SMA | 167.3 | 168.01 | 168.72 | | 50 day SMA | 171.21 | 171.26 | 171.28 | | 100 day SMA | 158.86 | 158.82 | 158.81 | | 150 day SMA | 169.34 | 169.82 | 170.3 | | 200 day SMA | 183.24 | 183.71 | 184.2 |
|
|
