BhartiyaInternational BIL full analysis,charts,indicators,moving averages,SMA,DMA,EMA,ADX,MACD,RSIBhartiya International BIL WideScreen charts, DMA,SMA,EMA technical analysis, forecast prediction, by indicators ADX,MACD,RSI,CCI NSE stock exchange
operates under Other Apparels & Accessories sector
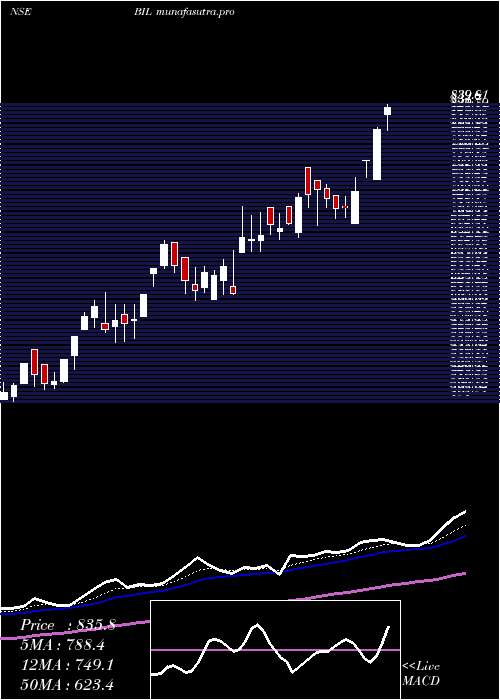
Daily price and charts and targets BhartiyaInternational Strong Daily Stock price targets for BhartiyaInternational BIL are 791.23 and 833.98 | Daily Target 1 | 758.07 | | Daily Target 2 | 781.63 | | Daily Target 3 | 800.81666666667 | | Daily Target 4 | 824.38 | | Daily Target 5 | 843.57 |
Daily price and volume Bhartiya International
| Date |
Closing |
Open |
Range |
Volume |
Tue 28 October 2025 |
805.20 (3.24%) |
781.80 |
777.25 - 820.00 |
2.5731 times |
Mon 27 October 2025 |
779.95 (1.28%) |
793.30 |
769.15 - 793.30 |
0.8903 times |
Fri 24 October 2025 |
770.10 (-0.91%) |
770.00 |
761.45 - 791.90 |
0.5545 times |
Thu 23 October 2025 |
777.20 (-0.12%) |
789.90 |
750.00 - 797.15 |
2.4406 times |
Tue 21 October 2025 |
778.15 (4.81%) |
740.00 |
740.00 - 785.00 |
0.3621 times |
Mon 20 October 2025 |
742.45 (-1.73%) |
755.55 |
721.05 - 787.00 |
0.7423 times |
Fri 17 October 2025 |
755.55 (-1.78%) |
780.80 |
740.10 - 780.85 |
0.0711 times |
Thu 16 October 2025 |
769.25 (2.44%) |
780.00 |
728.00 - 796.05 |
0.2272 times |
Wed 15 October 2025 |
750.90 (0.27%) |
770.55 |
714.05 - 770.55 |
1.1184 times |
Tue 14 October 2025 |
748.90 (-2.78%) |
770.35 |
736.55 - 777.80 |
1.0205 times |
Mon 13 October 2025 |
770.35 (-3.39%) |
800.00 |
760.15 - 813.20 |
0.5641 times |
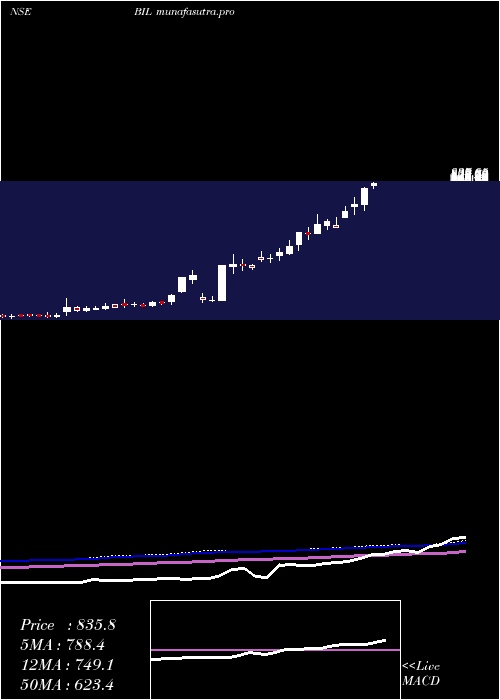
Weekly price and charts BhartiyaInternational Strong weekly Stock price targets for BhartiyaInternational BIL are 787.18 and 838.03 | Weekly Target 1 | 747.27 | | Weekly Target 2 | 776.23 | | Weekly Target 3 | 798.11666666667 | | Weekly Target 4 | 827.08 | | Weekly Target 5 | 848.97 |
Weekly price and volumes for Bhartiya International
| Date |
Closing |
Open |
Range |
Volume |
Tue 28 October 2025 |
805.20 (4.56%) |
793.30 |
769.15 - 820.00 |
0.9328 times |
Fri 24 October 2025 |
770.10 (1.93%) |
755.55 |
721.05 - 797.15 |
1.1041 times |
Fri 17 October 2025 |
755.55 (-5.25%) |
800.00 |
714.05 - 813.20 |
0.8083 times |
Fri 10 October 2025 |
797.40 (-4.7%) |
845.00 |
766.75 - 845.45 |
0.806 times |
Fri 03 October 2025 |
836.75 (-2.53%) |
890.00 |
805.00 - 890.00 |
0.6907 times |
Fri 26 September 2025 |
858.45 (-1.69%) |
870.00 |
839.95 - 942.70 |
1.0255 times |
Fri 19 September 2025 |
873.20 (0.77%) |
897.00 |
857.50 - 897.35 |
0.6238 times |
Fri 12 September 2025 |
866.55 (1.5%) |
856.50 |
836.00 - 908.00 |
0.7401 times |
Fri 05 September 2025 |
853.75 (2.01%) |
836.95 |
821.00 - 895.00 |
0.7471 times |
Fri 29 August 2025 |
836.95 (-0.12%) |
837.95 |
830.00 - 940.00 |
2.5215 times |
Fri 22 August 2025 |
837.95 (-4.37%) |
911.25 |
821.00 - 911.25 |
0.8833 times |
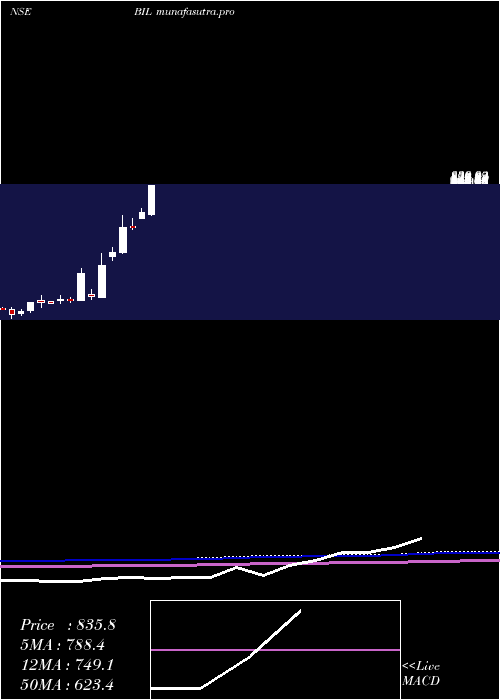
Monthly price and charts BhartiyaInternational Strong monthly Stock price targets for BhartiyaInternational BIL are 690.83 and 828.43 | Monthly Target 1 | 652.7 | | Monthly Target 2 | 728.95 | | Monthly Target 3 | 790.3 | | Monthly Target 4 | 866.55 | | Monthly Target 5 | 927.9 |
Monthly price and volumes Bhartiya International
| Date |
Closing |
Open |
Range |
Volume |
Tue 28 October 2025 |
805.20 (-4.49%) |
846.10 |
714.05 - 851.65 |
0.3669 times |
Tue 30 September 2025 |
843.05 (0.73%) |
836.95 |
821.00 - 942.70 |
0.2859 times |
Fri 29 August 2025 |
836.95 (-11.6%) |
979.00 |
805.50 - 979.00 |
0.5857 times |
Thu 31 July 2025 |
946.75 (35.26%) |
688.80 |
683.65 - 984.75 |
1.7499 times |
Mon 30 June 2025 |
699.95 (13.23%) |
666.00 |
666.00 - 719.85 |
0.0978 times |
Mon 07 October 2024 |
618.15 (-0.59%) |
625.10 |
611.10 - 668.40 |
0.144 times |
Mon 30 September 2024 |
621.80 (26.31%) |
488.15 |
485.10 - 679.85 |
1.9329 times |
Fri 30 August 2024 |
492.30 (16.51%) |
470.00 |
447.00 - 514.95 |
0.4494 times |
Mon 22 April 2024 |
422.55 (62.46%) |
257.00 |
257.00 - 485.00 |
3.831 times |
Thu 28 March 2024 |
260.10 (-32.12%) |
270.85 |
246.25 - 295.00 |
0.5566 times |
Tue 12 December 2023 |
383.15 (60.38%) |
240.30 |
240.15 - 407.70 |
6.992 times |
DMA SMA EMA moving averages of Bhartiya International BIL
DMA (daily moving average) of Bhartiya International BIL
| DMA period | DMA value | | 5 day DMA | 782.12 | | 12 day DMA | 770.45 | | 20 day DMA | 793.41 | | 35 day DMA | 827.09 | | 50 day DMA | 834.93 | | 100 day DMA | 802.73 | | 150 day DMA | 681.51 | | 200 day DMA | 572.97 | EMA (exponential moving average) of Bhartiya International BIL
| EMA period | EMA current | EMA prev | EMA prev2 | | 5 day EMA | 783.65 | 772.87 | 769.33 | | 12 day EMA | 783.49 | 779.55 | 779.48 | | 20 day EMA | 794.7 | 793.6 | 795.04 | | 35 day EMA | 810.77 | 811.1 | 812.93 | | 50 day EMA | 831.92 | 833.01 | 835.18 |
SMA (simple moving average) of Bhartiya International BIL
| SMA period | SMA current | SMA prev | SMA prev2 | | 5 day SMA | 782.12 | 769.57 | 764.69 | | 12 day SMA | 770.45 | 771.77 | 775.58 | | 20 day SMA | 793.41 | 796.07 | 800.57 | | 35 day SMA | 827.09 | 828.48 | 830.82 | | 50 day SMA | 834.93 | 836.28 | 838.16 | | 100 day SMA | 802.73 | 800.53 | 798.5 | | 150 day SMA | 681.51 | 678.69 | 675.96 | | 200 day SMA | 572.97 | 569.99 | 567.15 |
|
|
