BhageriaIndustries BHAGERIA full analysis,charts,indicators,moving averages,SMA,DMA,EMA,ADX,MACD,RSIBhageria Industries BHAGERIA WideScreen charts, DMA,SMA,EMA technical analysis, forecast prediction, by indicators ADX,MACD,RSI,CCI NSE stock exchange
operates under Commodity Chemicals sector
Daily price and charts and targets BhageriaIndustries Strong Daily Stock price targets for BhageriaIndustries BHAGERIA are 205.55 and 229.55 | Daily Target 1 | 200.7 | | Daily Target 2 | 210.39 | | Daily Target 3 | 224.69666666667 | | Daily Target 4 | 234.39 | | Daily Target 5 | 248.7 |
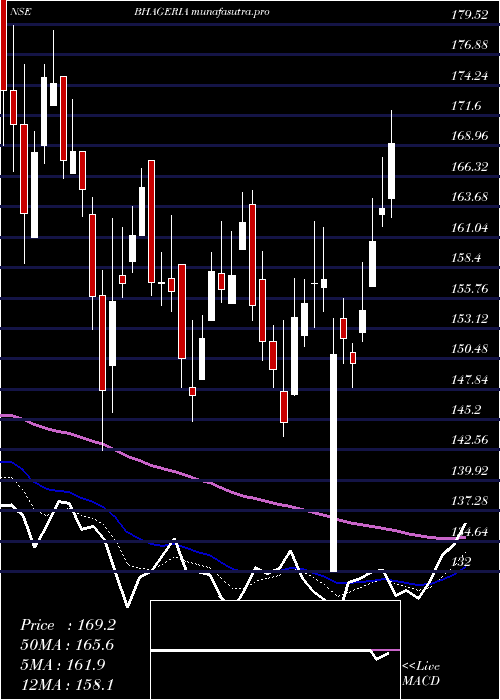
Daily price and volume Bhageria Industries
| Date |
Closing |
Open |
Range |
Volume |
Tue 28 October 2025 |
220.09 (-5.41%) |
227.81 |
215.00 - 239.00 |
0.4956 times |
Mon 27 October 2025 |
232.67 (-1.39%) |
237.00 |
224.10 - 244.00 |
0.7326 times |
Fri 24 October 2025 |
235.94 (3.21%) |
230.00 |
222.34 - 244.60 |
3.1084 times |
Thu 23 October 2025 |
228.60 (17.44%) |
199.30 |
199.00 - 233.59 |
3.5702 times |
Tue 21 October 2025 |
194.66 (3.22%) |
198.49 |
192.35 - 198.49 |
0.098 times |
Mon 20 October 2025 |
188.58 (9.14%) |
181.00 |
180.05 - 200.00 |
1.7086 times |
Fri 17 October 2025 |
172.78 (-1.1%) |
175.57 |
171.90 - 176.98 |
0.0513 times |
Thu 16 October 2025 |
174.70 (0.3%) |
175.80 |
174.14 - 177.95 |
0.0565 times |
Wed 15 October 2025 |
174.18 (0.25%) |
174.95 |
173.10 - 176.00 |
0.0967 times |
Tue 14 October 2025 |
173.74 (-0.56%) |
176.11 |
172.01 - 178.65 |
0.0821 times |
Mon 13 October 2025 |
174.71 (-5.84%) |
186.47 |
173.24 - 187.90 |
0.2349 times |
Weekly price and charts BhageriaIndustries Strong weekly Stock price targets for BhageriaIndustries BHAGERIA are 203.05 and 232.05 | Weekly Target 1 | 197.36 | | Weekly Target 2 | 208.73 | | Weekly Target 3 | 226.36333333333 | | Weekly Target 4 | 237.73 | | Weekly Target 5 | 255.36 |
Weekly price and volumes for Bhageria Industries
| Date |
Closing |
Open |
Range |
Volume |
Tue 28 October 2025 |
220.09 (-6.72%) |
237.00 |
215.00 - 244.00 |
0.9053 times |
Fri 24 October 2025 |
235.94 (36.56%) |
181.00 |
180.05 - 244.60 |
6.2543 times |
Fri 17 October 2025 |
172.78 (-6.88%) |
186.47 |
171.90 - 187.90 |
0.3844 times |
Fri 10 October 2025 |
185.54 (4.77%) |
179.00 |
173.95 - 187.00 |
0.4455 times |
Fri 03 October 2025 |
177.09 (-0.07%) |
178.00 |
172.37 - 181.90 |
0.1865 times |
Fri 26 September 2025 |
177.22 (-2.77%) |
182.40 |
172.22 - 189.00 |
0.5226 times |
Fri 19 September 2025 |
182.27 (-10.71%) |
204.13 |
180.92 - 220.50 |
0.9694 times |
Fri 12 September 2025 |
204.13 (2.61%) |
197.89 |
197.35 - 214.00 |
0.1389 times |
Fri 05 September 2025 |
198.93 (3.38%) |
194.70 |
190.05 - 205.00 |
0.0975 times |
Fri 29 August 2025 |
192.43 (7.71%) |
177.00 |
177.00 - 203.19 |
0.0956 times |
Fri 22 August 2025 |
178.65 (4.72%) |
171.14 |
171.14 - 180.74 |
0.0342 times |
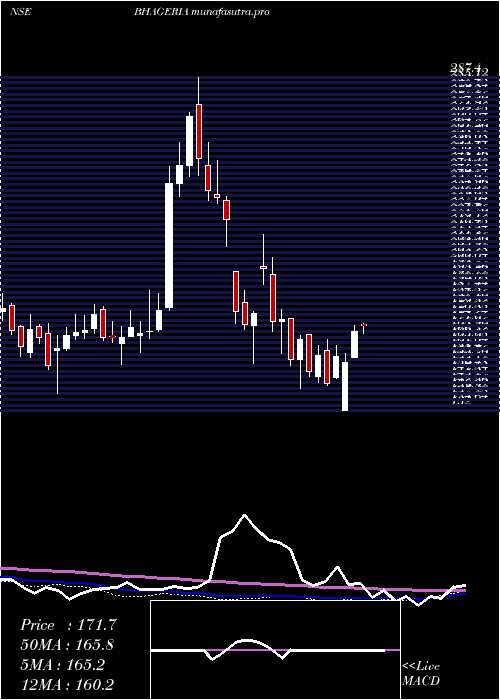
Monthly price and charts BhageriaIndustries Strong monthly Stock price targets for BhageriaIndustries BHAGERIA are 196 and 268.7 | Monthly Target 1 | 139.5 | | Monthly Target 2 | 179.79 | | Monthly Target 3 | 212.19666666667 | | Monthly Target 4 | 252.49 | | Monthly Target 5 | 284.9 |
Monthly price and volumes Bhageria Industries
| Date |
Closing |
Open |
Range |
Volume |
Tue 28 October 2025 |
220.09 (27.23%) |
174.72 |
171.90 - 244.60 |
6.6697 times |
Tue 30 September 2025 |
172.99 (-10.1%) |
194.70 |
172.22 - 220.50 |
1.4983 times |
Fri 29 August 2025 |
192.43 (-4.34%) |
201.80 |
169.25 - 206.09 |
0.2278 times |
Thu 31 July 2025 |
201.16 (-3.93%) |
212.00 |
192.30 - 217.72 |
0.2578 times |
Mon 30 June 2025 |
209.38 (12.65%) |
185.86 |
177.01 - 211.90 |
0.2323 times |
Fri 30 May 2025 |
185.86 (22.35%) |
153.91 |
144.51 - 205.00 |
0.2227 times |
Wed 30 April 2025 |
151.91 (4.79%) |
147.40 |
132.00 - 174.90 |
0.1126 times |
Fri 28 March 2025 |
144.97 (-7.01%) |
156.00 |
142.52 - 167.69 |
0.1816 times |
Fri 28 February 2025 |
155.90 (-12.03%) |
199.50 |
152.99 - 214.53 |
0.4782 times |
Fri 31 January 2025 |
177.21 (-19.9%) |
197.01 |
154.10 - 197.01 |
0.119 times |
Wed 09 October 2024 |
221.24 (-7.57%) |
240.56 |
208.51 - 249.00 |
0.1787 times |

DMA SMA EMA moving averages of Bhageria Industries BHAGERIA
DMA (daily moving average) of Bhageria Industries BHAGERIA
| DMA period | DMA value | | 5 day DMA | 222.39 | | 12 day DMA | 196.35 | | 20 day DMA | 188.41 | | 35 day DMA | 188.71 | | 50 day DMA | 187.87 | | 100 day DMA | 190.37 | | 150 day DMA | 182.03 | | 200 day DMA | 180.56 | EMA (exponential moving average) of Bhageria Industries BHAGERIA
| EMA period | EMA current | EMA prev | EMA prev2 | | 5 day EMA | 219.03 | 218.5 | 211.41 | | 12 day EMA | 204.16 | 201.27 | 195.56 | | 20 day EMA | 196.57 | 194.1 | 190.04 | | 35 day EMA | 191.44 | 189.75 | 187.22 | | 50 day EMA | 190.39 | 189.18 | 187.41 |
SMA (simple moving average) of Bhageria Industries BHAGERIA
| SMA period | SMA current | SMA prev | SMA prev2 | | 5 day SMA | 222.39 | 216.09 | 204.11 | | 12 day SMA | 196.35 | 193.21 | 188.53 | | 20 day SMA | 188.41 | 186.27 | 183.4 | | 35 day SMA | 188.71 | 188.1 | 187.2 | | 50 day SMA | 187.87 | 186.96 | 185.84 | | 100 day SMA | 190.37 | 190.06 | 189.59 | | 150 day SMA | 182.03 | 181.62 | 181.09 | | 200 day SMA | 180.56 | 180.65 | 180.7 |
|
|
