MiraeamcMafsetf BFSI full analysis,charts,indicators,moving averages,SMA,DMA,EMA,ADX,MACD,RSIMiraeamc Mafsetf BFSI WideScreen charts, DMA,SMA,EMA technical analysis, forecast prediction, by indicators ADX,MACD,RSI,CCI NSE stock exchange
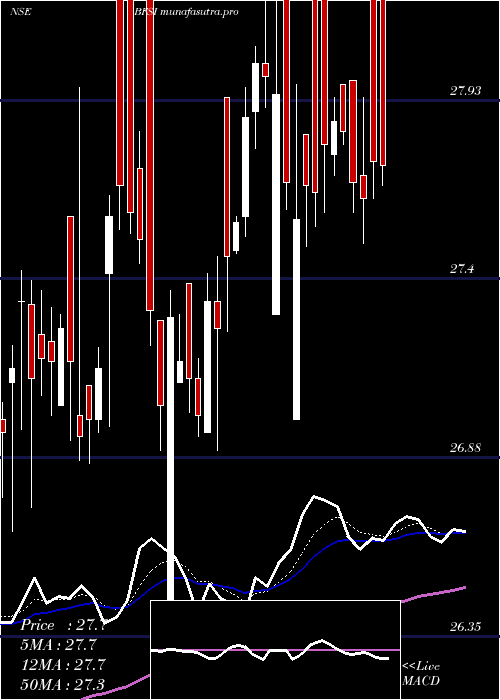
Daily price and charts and targets MiraeamcMafsetf Strong Daily Stock price targets for MiraeamcMafsetf BFSI are 28.16 and 28.44 | Daily Target 1 | 28.08 | | Daily Target 2 | 28.24 | | Daily Target 3 | 28.363333333333 | | Daily Target 4 | 28.52 | | Daily Target 5 | 28.64 |
Daily price and volume Miraeamc Mafsetf
| Date |
Closing |
Open |
Range |
Volume |
Tue 28 October 2025 |
28.39 (-0.25%) |
28.43 |
28.21 - 28.49 |
0.6609 times |
Mon 27 October 2025 |
28.46 (0.64%) |
28.60 |
28.24 - 28.60 |
0.5661 times |
Fri 24 October 2025 |
28.28 (-0.7%) |
28.48 |
28.19 - 28.56 |
0.9412 times |
Thu 23 October 2025 |
28.48 (0.04%) |
28.04 |
28.04 - 29.02 |
0.8327 times |
Tue 21 October 2025 |
28.47 (0.18%) |
28.45 |
28.40 - 28.76 |
0.4588 times |
Mon 20 October 2025 |
28.42 (-0.04%) |
28.51 |
28.40 - 28.65 |
1.0718 times |
Fri 17 October 2025 |
28.43 (0.89%) |
28.32 |
28.20 - 28.50 |
1.1071 times |
Thu 16 October 2025 |
28.18 (0.86%) |
28.07 |
27.80 - 28.32 |
2.2412 times |
Wed 15 October 2025 |
27.94 (0.72%) |
28.20 |
27.40 - 28.20 |
1.3881 times |
Tue 14 October 2025 |
27.74 (-0.18%) |
27.65 |
27.59 - 27.92 |
0.7322 times |
Mon 13 October 2025 |
27.79 (0.18%) |
27.97 |
27.55 - 27.98 |
0.9235 times |
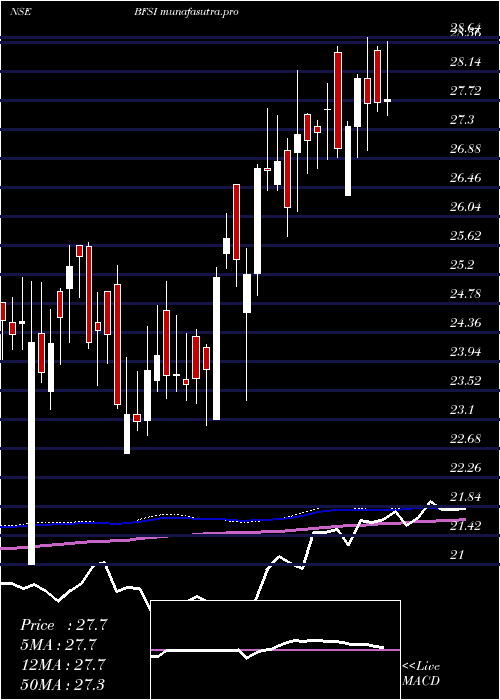
Weekly price and charts MiraeamcMafsetf Strong weekly Stock price targets for MiraeamcMafsetf BFSI are 28.11 and 28.5 | Weekly Target 1 | 28.01 | | Weekly Target 2 | 28.2 | | Weekly Target 3 | 28.4 | | Weekly Target 4 | 28.59 | | Weekly Target 5 | 28.79 |
Weekly price and volumes for Miraeamc Mafsetf
| Date |
Closing |
Open |
Range |
Volume |
Tue 28 October 2025 |
28.39 (0.39%) |
28.60 |
28.21 - 28.60 |
0.3734 times |
Fri 24 October 2025 |
28.28 (-0.53%) |
28.51 |
28.04 - 29.02 |
1.0056 times |
Fri 17 October 2025 |
28.43 (2.49%) |
27.97 |
27.40 - 28.50 |
1.9451 times |
Fri 10 October 2025 |
27.74 (1.69%) |
27.72 |
26.46 - 28.20 |
1.3101 times |
Fri 03 October 2025 |
27.28 (1.53%) |
26.19 |
26.00 - 27.95 |
0.4689 times |
Fri 26 September 2025 |
26.87 (-2.04%) |
28.25 |
26.31 - 28.25 |
0.5164 times |
Fri 19 September 2025 |
27.43 (0.59%) |
27.27 |
26.59 - 27.69 |
0.9019 times |
Fri 12 September 2025 |
27.27 (1.83%) |
26.79 |
26.72 - 27.29 |
1.1144 times |
Fri 05 September 2025 |
26.78 (1.25%) |
25.78 |
25.78 - 27.18 |
1.2242 times |
Fri 29 August 2025 |
26.45 (-2.83%) |
27.53 |
26.40 - 27.59 |
1.1402 times |
Fri 22 August 2025 |
27.22 (-0.11%) |
27.66 |
27.10 - 28.35 |
0.589 times |
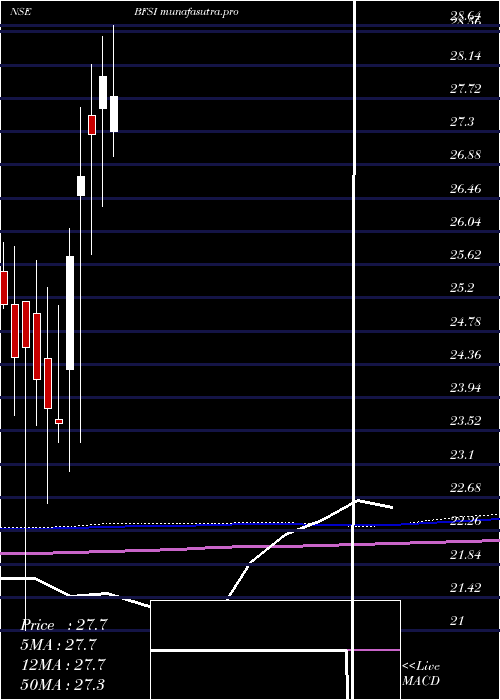
Monthly price and charts MiraeamcMafsetf Strong monthly Stock price targets for MiraeamcMafsetf BFSI are 27.31 and 30.11 | Monthly Target 1 | 25.08 | | Monthly Target 2 | 26.73 | | Monthly Target 3 | 27.876666666667 | | Monthly Target 4 | 29.53 | | Monthly Target 5 | 30.68 |
Monthly price and volumes Miraeamc Mafsetf
| Date |
Closing |
Open |
Range |
Volume |
Tue 28 October 2025 |
28.39 (5.54%) |
26.22 |
26.22 - 29.02 |
0.6818 times |
Tue 30 September 2025 |
26.90 (1.7%) |
25.78 |
25.78 - 28.25 |
0.5368 times |
Fri 29 August 2025 |
26.45 (-3.61%) |
28.26 |
26.40 - 28.35 |
0.633 times |
Thu 31 July 2025 |
27.44 (-2%) |
27.30 |
26.91 - 28.70 |
0.7687 times |
Mon 30 June 2025 |
28.00 (2.71%) |
27.59 |
26.35 - 28.50 |
0.9951 times |
Fri 30 May 2025 |
27.26 (1.94%) |
27.50 |
25.75 - 28.15 |
0.7173 times |
Wed 30 April 2025 |
26.74 (3.97%) |
26.50 |
23.38 - 27.60 |
1.2615 times |
Fri 28 March 2025 |
25.72 (8.94%) |
24.30 |
23.01 - 26.08 |
2.343 times |
Fri 28 February 2025 |
23.61 (-0.84%) |
23.67 |
23.37 - 25.10 |
0.5378 times |
Fri 31 January 2025 |
23.81 (-1.49%) |
24.44 |
22.60 - 25.33 |
1.5249 times |
Tue 31 December 2024 |
24.17 (-1.67%) |
25.00 |
23.59 - 25.67 |
0.4148 times |
DMA SMA EMA moving averages of Miraeamc Mafsetf BFSI
DMA (daily moving average) of Miraeamc Mafsetf BFSI
| DMA period | DMA value | | 5 day DMA | 28.42 | | 12 day DMA | 28.19 | | 20 day DMA | 27.86 | | 35 day DMA | 27.58 | | 50 day DMA | 27.4 | | 100 day DMA | 27.45 | | 150 day DMA | 27.11 | | 200 day DMA | 26.26 | EMA (exponential moving average) of Miraeamc Mafsetf BFSI
| EMA period | EMA current | EMA prev | EMA prev2 | | 5 day EMA | 28.38 | 28.37 | 28.33 | | 12 day EMA | 28.2 | 28.16 | 28.1 | | 20 day EMA | 27.98 | 27.94 | 27.88 | | 35 day EMA | 27.72 | 27.68 | 27.63 | | 50 day EMA | 27.49 | 27.45 | 27.41 |
SMA (simple moving average) of Miraeamc Mafsetf BFSI
| SMA period | SMA current | SMA prev | SMA prev2 | | 5 day SMA | 28.42 | 28.42 | 28.42 | | 12 day SMA | 28.19 | 28.13 | 28.05 | | 20 day SMA | 27.86 | 27.78 | 27.71 | | 35 day SMA | 27.58 | 27.53 | 27.49 | | 50 day SMA | 27.4 | 27.37 | 27.34 | | 100 day SMA | 27.45 | 27.44 | 27.42 | | 150 day SMA | 27.11 | 27.08 | 27.06 | | 200 day SMA | 26.26 | 26.23 | 26.21 |
|
|
