BewEngineering BEWLTD_SM full analysis,charts,indicators,moving averages,SMA,DMA,EMA,ADX,MACD,RSIBew Engineering BEWLTD_SM WideScreen charts, DMA,SMA,EMA technical analysis, forecast prediction, by indicators ADX,MACD,RSI,CCI NSE stock exchange
Daily price and charts and targets BewEngineering Strong Daily Stock price targets for BewEngineering BEWLTD_SM are 126.68 and 131.68 | Daily Target 1 | 125.38 | | Daily Target 2 | 127.97 | | Daily Target 3 | 130.38333333333 | | Daily Target 4 | 132.97 | | Daily Target 5 | 135.38 |
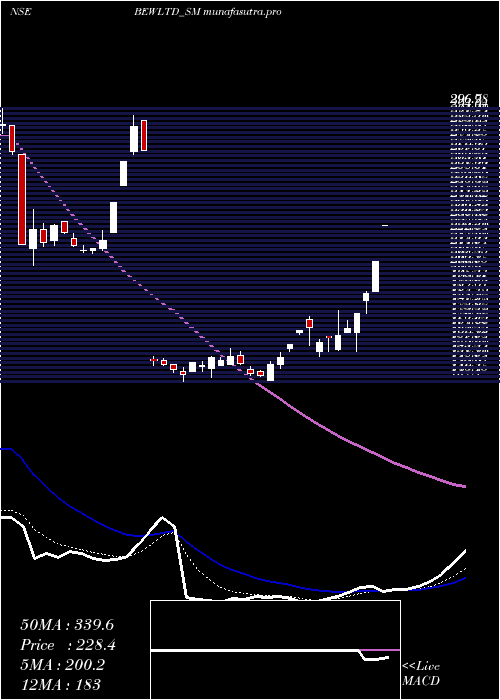
Daily price and volume Bew Engineering
| Date |
Closing |
Open |
Range |
Volume |
Tue 28 October 2025 |
130.55 (-1.69%) |
132.80 |
127.80 - 132.80 |
0.8982 times |
Mon 27 October 2025 |
132.80 (-8.29%) |
147.00 |
131.00 - 147.00 |
2.7246 times |
Fri 24 October 2025 |
144.80 (7.5%) |
136.00 |
134.70 - 145.00 |
0.509 times |
Thu 23 October 2025 |
134.70 (3.1%) |
130.30 |
130.25 - 136.90 |
0.5689 times |
Tue 21 October 2025 |
130.65 (1.01%) |
130.00 |
130.00 - 132.70 |
0.7784 times |
Mon 20 October 2025 |
129.35 (5.59%) |
125.75 |
124.50 - 131.90 |
0.5988 times |
Fri 17 October 2025 |
122.50 (-5.19%) |
124.45 |
121.60 - 125.30 |
0.988 times |
Thu 16 October 2025 |
129.20 (5.9%) |
122.65 |
122.65 - 131.00 |
0.9281 times |
Wed 15 October 2025 |
122.00 (-2.79%) |
125.00 |
120.00 - 136.50 |
1.8263 times |
Tue 14 October 2025 |
125.50 (-3.57%) |
125.00 |
125.00 - 128.85 |
0.1796 times |
Mon 13 October 2025 |
130.15 (-0.53%) |
132.00 |
129.25 - 132.00 |
0.8982 times |
Weekly price and charts BewEngineering Strong weekly Stock price targets for BewEngineering BEWLTD_SM are 119.58 and 138.78 | Weekly Target 1 | 115.92 | | Weekly Target 2 | 123.23 | | Weekly Target 3 | 135.11666666667 | | Weekly Target 4 | 142.43 | | Weekly Target 5 | 154.32 |
Weekly price and volumes for Bew Engineering
| Date |
Closing |
Open |
Range |
Volume |
Tue 28 October 2025 |
130.55 (-9.84%) |
147.00 |
127.80 - 147.00 |
0.9091 times |
Fri 24 October 2025 |
144.80 (18.2%) |
125.75 |
124.50 - 145.00 |
0.6161 times |
Fri 17 October 2025 |
122.50 (-6.38%) |
132.00 |
120.00 - 136.50 |
1.2096 times |
Fri 10 October 2025 |
130.85 (-7.85%) |
142.00 |
128.70 - 148.35 |
0.7964 times |
Fri 03 October 2025 |
142.00 (-2.1%) |
141.65 |
138.00 - 144.75 |
0.6086 times |
Fri 26 September 2025 |
145.05 (-5.93%) |
154.20 |
145.00 - 155.00 |
1.6679 times |
Fri 19 September 2025 |
154.20 (1.05%) |
150.60 |
150.50 - 158.85 |
0.7062 times |
Fri 12 September 2025 |
152.60 (-3.05%) |
155.05 |
150.00 - 159.30 |
1.5552 times |
Fri 05 September 2025 |
157.40 (-0.94%) |
153.55 |
150.00 - 159.00 |
1.0894 times |
Fri 29 August 2025 |
158.90 (-2.69%) |
160.00 |
157.05 - 164.00 |
0.8415 times |
Fri 22 August 2025 |
163.30 (-18.12%) |
158.05 |
153.05 - 166.00 |
1.2246 times |

Monthly price and charts BewEngineering Strong monthly Stock price targets for BewEngineering BEWLTD_SM are 111.1 and 139.45 | Monthly Target 1 | 104.62 | | Monthly Target 2 | 117.58 | | Monthly Target 3 | 132.96666666667 | | Monthly Target 4 | 145.93 | | Monthly Target 5 | 161.32 |
Monthly price and volumes Bew Engineering
| Date |
Closing |
Open |
Range |
Volume |
Tue 28 October 2025 |
130.55 (-6.15%) |
142.00 |
120.00 - 148.35 |
0.6715 times |
Tue 30 September 2025 |
139.10 (-12.46%) |
153.55 |
138.00 - 159.30 |
0.9591 times |
Fri 29 August 2025 |
158.90 (-20.33%) |
158.05 |
153.05 - 166.00 |
0.3679 times |
Fri 16 May 2025 |
199.45 (1.32%) |
199.90 |
179.55 - 211.25 |
0.4789 times |
Wed 30 April 2025 |
196.85 (33.78%) |
147.15 |
145.00 - 239.80 |
1.5544 times |
Fri 28 March 2025 |
147.15 (-45.94%) |
150.00 |
137.40 - 156.95 |
1.4273 times |
Thu 05 December 2024 |
272.20 (23.7%) |
224.45 |
224.45 - 292.85 |
0.6421 times |
Fri 29 November 2024 |
220.05 (-27.45%) |
300.00 |
204.95 - 345.00 |
3.4619 times |
Thu 31 October 2024 |
303.30 (-78.86%) |
1450.00 |
300.10 - 1505.00 |
0.307 times |
Mon 30 September 2024 |
1435.00 (-0.35%) |
1450.00 |
1330.00 - 1498.90 |
0.1301 times |
Fri 30 August 2024 |
1440.00 (-2.66%) |
1455.00 |
1351.00 - 1500.00 |
0.0635 times |

DMA SMA EMA moving averages of Bew Engineering BEWLTD_SM
DMA (daily moving average) of Bew Engineering BEWLTD_SM
| DMA period | DMA value | | 5 day DMA | 134.7 | | 12 day DMA | 130.25 | | 20 day DMA | 135.06 | | 35 day DMA | 143 | | 50 day DMA | 148.04 | | 100 day DMA | 167.55 | | 150 day DMA | 437.1 | | 200 day DMA | 699.64 | EMA (exponential moving average) of Bew Engineering BEWLTD_SM
| EMA period | EMA current | EMA prev | EMA prev2 | | 5 day EMA | 133.19 | 134.51 | 135.37 | | 12 day EMA | 133.62 | 134.18 | 134.43 | | 20 day EMA | 136.49 | 137.12 | 137.57 | | 35 day EMA | 143.2 | 143.94 | 144.6 | | 50 day EMA | 151.04 | 151.88 | 152.66 |
SMA (simple moving average) of Bew Engineering BEWLTD_SM
| SMA period | SMA current | SMA prev | SMA prev2 | | 5 day SMA | 134.7 | 134.46 | 132.4 | | 12 day SMA | 130.25 | 131 | 131.77 | | 20 day SMA | 135.06 | 135.78 | 136.65 | | 35 day SMA | 143 | 143.77 | 144.3 | | 50 day SMA | 148.04 | 149.51 | 150.87 | | 100 day SMA | 167.55 | 168.53 | 169.39 | | 150 day SMA | 437.1 | 445.87 | 454.31 | | 200 day SMA | 699.64 | 706.47 | 712.83 |
|
|
