BellaCasa BELLACASA full analysis,charts,indicators,moving averages,SMA,DMA,EMA,ADX,MACD,RSIBella Casa BELLACASA WideScreen charts, DMA,SMA,EMA technical analysis, forecast prediction, by indicators ADX,MACD,RSI,CCI NSE stock exchange
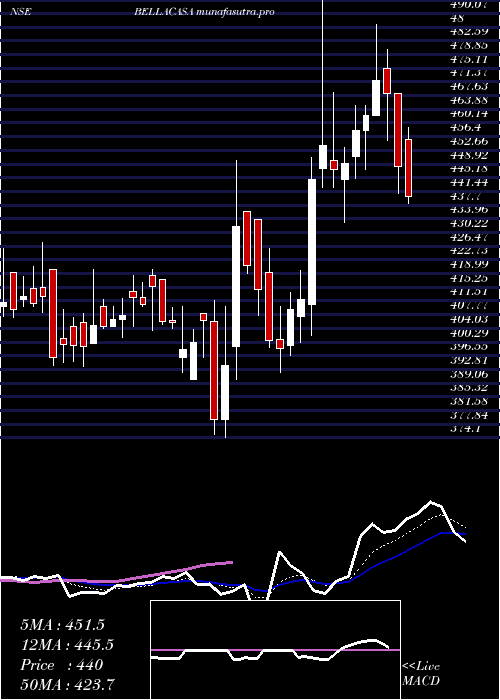
Daily price and charts and targets BellaCasa Strong Daily Stock price targets for BellaCasa BELLACASA are 428.55 and 449.5 | Daily Target 1 | 424.73 | | Daily Target 2 | 432.37 | | Daily Target 3 | 445.68333333333 | | Daily Target 4 | 453.32 | | Daily Target 5 | 466.63 |
Daily price and volume Bella Casa
| Date |
Closing |
Open |
Range |
Volume |
Tue 28 October 2025 |
440.00 (-1.85%) |
455.70 |
438.05 - 459.00 |
0.1431 times |
Mon 27 October 2025 |
448.30 (-4.24%) |
468.15 |
441.00 - 468.15 |
0.2428 times |
Fri 24 October 2025 |
468.15 (-0.75%) |
475.00 |
455.35 - 480.10 |
0.5499 times |
Thu 23 October 2025 |
471.70 (2.06%) |
462.20 |
462.20 - 487.00 |
0.8939 times |
Tue 21 October 2025 |
462.20 (0.9%) |
458.10 |
447.30 - 465.00 |
0.0843 times |
Mon 20 October 2025 |
458.10 (2.03%) |
451.00 |
445.05 - 465.00 |
0.3208 times |
Fri 17 October 2025 |
449.00 (0.34%) |
444.75 |
433.00 - 453.50 |
0.2475 times |
Thu 16 October 2025 |
447.50 (-1.42%) |
449.90 |
442.50 - 468.35 |
0.5834 times |
Wed 15 October 2025 |
453.95 (2.11%) |
447.75 |
442.50 - 497.35 |
5.1013 times |
Tue 14 October 2025 |
444.55 (7.94%) |
410.45 |
402.00 - 450.70 |
1.833 times |
Mon 13 October 2025 |
411.85 (0.62%) |
407.20 |
400.30 - 419.90 |
0.1868 times |
Weekly price and charts BellaCasa Strong weekly Stock price targets for BellaCasa BELLACASA are 423.98 and 454.08 | Weekly Target 1 | 418.63 | | Weekly Target 2 | 429.32 | | Weekly Target 3 | 448.73333333333 | | Weekly Target 4 | 459.42 | | Weekly Target 5 | 478.83 |
Weekly price and volumes for Bella Casa
| Date |
Closing |
Open |
Range |
Volume |
Tue 28 October 2025 |
440.00 (-6.01%) |
468.15 |
438.05 - 468.15 |
0.2085 times |
Fri 24 October 2025 |
468.15 (4.27%) |
451.00 |
445.05 - 487.00 |
0.9987 times |
Fri 17 October 2025 |
449.00 (9.7%) |
407.20 |
400.30 - 497.35 |
4.2955 times |
Fri 10 October 2025 |
409.30 (-5.24%) |
435.90 |
392.00 - 435.90 |
0.6768 times |
Fri 03 October 2025 |
431.95 (7.97%) |
408.00 |
374.10 - 449.80 |
1.7096 times |
Fri 26 September 2025 |
400.05 (-2.52%) |
418.55 |
390.00 - 420.00 |
0.4088 times |
Fri 19 September 2025 |
410.40 (1.38%) |
410.00 |
401.55 - 418.50 |
0.25 times |
Fri 12 September 2025 |
404.80 (-1.94%) |
420.00 |
393.55 - 420.00 |
0.4771 times |
Fri 05 September 2025 |
412.80 (-0.64%) |
410.10 |
407.00 - 427.40 |
0.3068 times |
Fri 29 August 2025 |
415.45 (-4.38%) |
432.15 |
397.00 - 433.30 |
0.6682 times |
Fri 22 August 2025 |
434.50 (5.07%) |
418.90 |
398.20 - 464.90 |
1.4732 times |
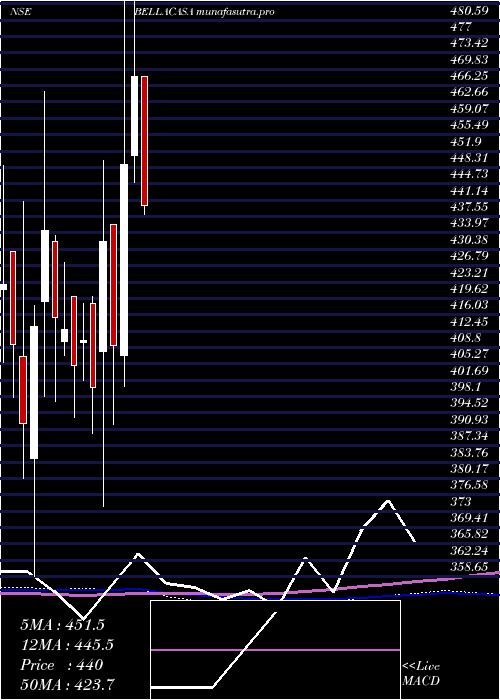
Monthly price and charts BellaCasa Strong monthly Stock price targets for BellaCasa BELLACASA are 407.05 and 530.3 | Monthly Target 1 | 313.9 | | Monthly Target 2 | 376.95 | | Monthly Target 3 | 437.15 | | Monthly Target 4 | 500.2 | | Monthly Target 5 | 560.4 |
Monthly price and volumes Bella Casa
| Date |
Closing |
Open |
Range |
Volume |
Tue 28 October 2025 |
440.00 (16.05%) |
379.15 |
374.10 - 497.35 |
1.8774 times |
Tue 30 September 2025 |
379.15 (-8.74%) |
410.10 |
375.00 - 427.40 |
0.4537 times |
Fri 29 August 2025 |
415.45 (2.25%) |
418.00 |
358.65 - 464.90 |
1.235 times |
Thu 31 July 2025 |
406.30 (0%) |
428.70 |
397.85 - 448.80 |
0.434 times |
Tue 28 October 2025 |
(0%) |
|
- |
0 times |

DMA SMA EMA moving averages of Bella Casa BELLACASA
DMA (daily moving average) of Bella Casa BELLACASA
| DMA period | DMA value | | 5 day DMA | 458.07 | | 12 day DMA | 447.05 | | 20 day DMA | 430.54 | | 35 day DMA | 419.32 | | 50 day DMA | 417.01 | | 100 day DMA | | | 150 day DMA | | | 200 day DMA | | EMA (exponential moving average) of Bella Casa BELLACASA
| EMA period | EMA current | EMA prev | EMA prev2 | | 5 day EMA | 451.49 | 457.23 | 461.69 | | 12 day EMA | 445.53 | 446.54 | 446.22 | | 20 day EMA | 436.96 | 436.64 | 435.41 | | 35 day EMA | 427.4 | 426.66 | 425.39 | | 50 day EMA | 419.04 | 418.18 | 416.95 |
SMA (simple moving average) of Bella Casa BELLACASA
| SMA period | SMA current | SMA prev | SMA prev2 | | 5 day SMA | 458.07 | 461.69 | 461.83 | | 12 day SMA | 447.05 | 443.6 | 439.63 | | 20 day SMA | 430.54 | 428.55 | 426.04 | | 35 day SMA | 419.32 | 418.55 | 417.48 | | 50 day SMA | 417.01 | 416.27 | 414.93 | | 100 day SMA | | 150 day SMA | | 200 day SMA |
|
|
