BedmuthaIndustries BEDMUTHA full analysis,charts,indicators,moving averages,SMA,DMA,EMA,ADX,MACD,RSIBedmutha Industries BEDMUTHA WideScreen charts, DMA,SMA,EMA technical analysis, forecast prediction, by indicators ADX,MACD,RSI,CCI NSE stock exchange
operates under Iron & Steel Products sector
Daily price and charts and targets BedmuthaIndustries Strong Daily Stock price targets for BedmuthaIndustries BEDMUTHA are 128.09 and 131.72 | Daily Target 1 | 127.31 | | Daily Target 2 | 128.87 | | Daily Target 3 | 130.93666666667 | | Daily Target 4 | 132.5 | | Daily Target 5 | 134.57 |
Daily price and volume Bedmutha Industries
| Date |
Closing |
Open |
Range |
Volume |
Wed 29 October 2025 |
130.44 (-1.17%) |
132.00 |
129.37 - 133.00 |
1.248 times |
Tue 28 October 2025 |
131.98 (-0.49%) |
132.64 |
130.00 - 134.45 |
1.3786 times |
Mon 27 October 2025 |
132.63 (0.03%) |
133.01 |
130.56 - 133.01 |
0.6817 times |
Fri 24 October 2025 |
132.59 (-0.4%) |
136.00 |
131.51 - 136.00 |
0.615 times |
Thu 23 October 2025 |
133.12 (0.46%) |
132.60 |
131.50 - 136.00 |
0.7814 times |
Tue 21 October 2025 |
132.51 (-1.55%) |
134.61 |
130.37 - 138.29 |
0.339 times |
Mon 20 October 2025 |
134.60 (3.02%) |
130.65 |
128.11 - 136.00 |
0.7858 times |
Fri 17 October 2025 |
130.65 (-0.65%) |
132.70 |
129.00 - 132.70 |
0.9707 times |
Thu 16 October 2025 |
131.50 (-0.96%) |
132.78 |
130.10 - 134.00 |
1.427 times |
Wed 15 October 2025 |
132.78 (-0.4%) |
133.32 |
131.98 - 135.48 |
1.7727 times |
Tue 14 October 2025 |
133.31 (-0.19%) |
133.00 |
132.00 - 135.65 |
0.8223 times |
Weekly price and charts BedmuthaIndustries Strong weekly Stock price targets for BedmuthaIndustries BEDMUTHA are 127.37 and 132.45 | Weekly Target 1 | 126.34 | | Weekly Target 2 | 128.39 | | Weekly Target 3 | 131.42 | | Weekly Target 4 | 133.47 | | Weekly Target 5 | 136.5 |
Weekly price and volumes for Bedmutha Industries
| Date |
Closing |
Open |
Range |
Volume |
Wed 29 October 2025 |
130.44 (-1.62%) |
133.01 |
129.37 - 134.45 |
0.3327 times |
Fri 24 October 2025 |
132.59 (1.48%) |
130.65 |
128.11 - 138.29 |
0.2535 times |
Fri 17 October 2025 |
130.65 (-3.29%) |
134.00 |
129.00 - 135.65 |
0.5629 times |
Fri 10 October 2025 |
135.10 (-2.8%) |
137.07 |
133.12 - 141.99 |
0.9673 times |
Fri 03 October 2025 |
138.99 (2.94%) |
134.35 |
133.00 - 140.95 |
0.4486 times |
Fri 26 September 2025 |
135.02 (-5.28%) |
142.55 |
134.10 - 144.00 |
0.7053 times |
Fri 19 September 2025 |
142.55 (0.3%) |
142.93 |
139.92 - 145.00 |
0.7562 times |
Fri 12 September 2025 |
142.13 (5.5%) |
137.30 |
132.01 - 154.90 |
4.635 times |
Fri 05 September 2025 |
134.72 (-1.04%) |
139.90 |
132.22 - 139.90 |
0.8592 times |
Fri 29 August 2025 |
136.14 (-2.42%) |
139.51 |
134.01 - 140.43 |
0.4794 times |
Fri 22 August 2025 |
139.51 (1.02%) |
139.00 |
134.71 - 143.16 |
1.6613 times |
Monthly price and charts BedmuthaIndustries Strong monthly Stock price targets for BedmuthaIndustries BEDMUTHA are 122.34 and 136.22 | Monthly Target 1 | 119.63 | | Monthly Target 2 | 125.04 | | Monthly Target 3 | 133.51333333333 | | Monthly Target 4 | 138.92 | | Monthly Target 5 | 147.39 |
Monthly price and volumes Bedmutha Industries
| Date |
Closing |
Open |
Range |
Volume |
Wed 29 October 2025 |
130.44 (-3.71%) |
138.01 |
128.11 - 141.99 |
0.3397 times |
Tue 30 September 2025 |
135.47 (-0.49%) |
139.90 |
132.01 - 154.90 |
0.9957 times |
Fri 29 August 2025 |
136.14 (-4.11%) |
143.30 |
134.01 - 164.90 |
1.3444 times |
Thu 31 July 2025 |
141.98 (-6.3%) |
153.69 |
139.00 - 154.85 |
1.0878 times |
Mon 30 June 2025 |
151.52 (-5.27%) |
158.10 |
146.00 - 186.66 |
1.5368 times |
Fri 30 May 2025 |
159.95 (-0.36%) |
167.00 |
146.95 - 170.00 |
0.5804 times |
Wed 30 April 2025 |
160.53 (-0.73%) |
164.85 |
138.00 - 171.50 |
0.3737 times |
Fri 28 March 2025 |
161.71 (4.61%) |
157.00 |
149.11 - 179.85 |
1.1427 times |
Fri 28 February 2025 |
154.59 (-19.71%) |
190.00 |
135.01 - 199.58 |
1.6691 times |
Fri 31 January 2025 |
192.53 (-3.68%) |
203.40 |
180.00 - 216.00 |
0.9298 times |
Tue 31 December 2024 |
199.88 (-0.6%) |
201.10 |
193.10 - 236.33 |
1.1072 times |
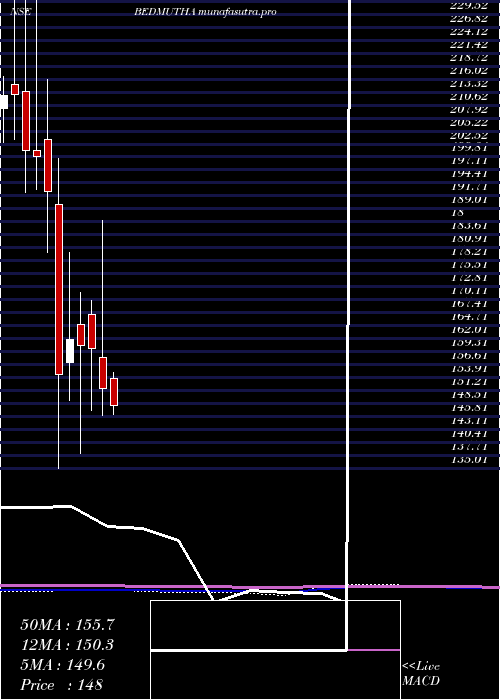
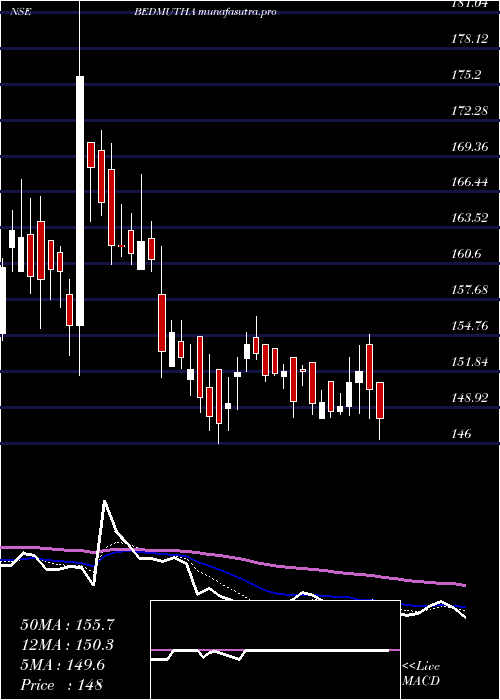
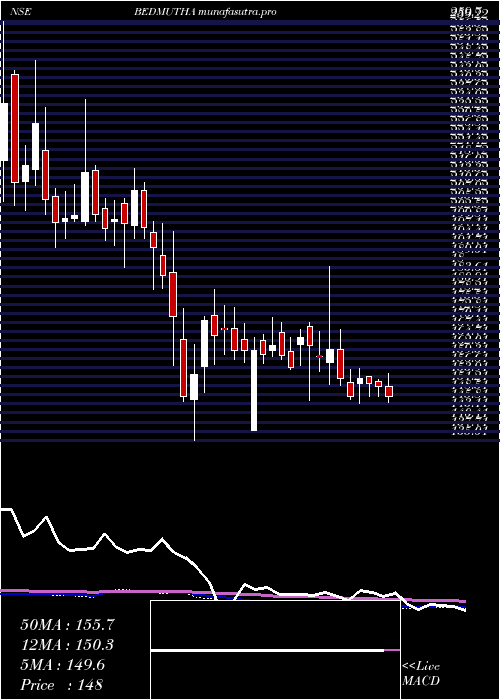
DMA SMA EMA moving averages of Bedmutha Industries BEDMUTHA
DMA (daily moving average) of Bedmutha Industries BEDMUTHA
| DMA period | DMA value | | 5 day DMA | 132.15 | | 12 day DMA | 132.47 | | 20 day DMA | 134.1 | | 35 day DMA | 136.97 | | 50 day DMA | 136.86 | | 100 day DMA | 142.75 | | 150 day DMA | 149.36 | | 200 day DMA | 156.65 | EMA (exponential moving average) of Bedmutha Industries BEDMUTHA
| EMA period | EMA current | EMA prev | EMA prev2 | | 5 day EMA | 131.82 | 132.51 | 132.77 | | 12 day EMA | 132.82 | 133.25 | 133.48 | | 20 day EMA | 133.9 | 134.26 | 134.5 | | 35 day EMA | 135.18 | 135.46 | 135.66 | | 50 day EMA | 136.6 | 136.85 | 137.05 |
SMA (simple moving average) of Bedmutha Industries BEDMUTHA
| SMA period | SMA current | SMA prev | SMA prev2 | | 5 day SMA | 132.15 | 132.57 | 133.09 | | 12 day SMA | 132.47 | 132.86 | 133.24 | | 20 day SMA | 134.1 | 134.26 | 134.41 | | 35 day SMA | 136.97 | 137.05 | 137.13 | | 50 day SMA | 136.86 | 137.01 | 137.15 | | 100 day SMA | 142.75 | 143.1 | 143.46 | | 150 day SMA | 149.36 | 149.65 | 149.89 | | 200 day SMA | 156.65 | 157.01 | 157.33 |
|
|
