BclIndustries BCLIND full analysis,charts,indicators,moving averages,SMA,DMA,EMA,ADX,MACD,RSIBcl Industries BCLIND WideScreen charts, DMA,SMA,EMA technical analysis, forecast prediction, by indicators ADX,MACD,RSI,CCI NSE stock exchange
Daily price and charts and targets BclIndustries Strong Daily Stock price targets for BclIndustries BCLIND are 39.41 and 40.51 | Daily Target 1 | 39.21 | | Daily Target 2 | 39.61 | | Daily Target 3 | 40.306666666667 | | Daily Target 4 | 40.71 | | Daily Target 5 | 41.41 |
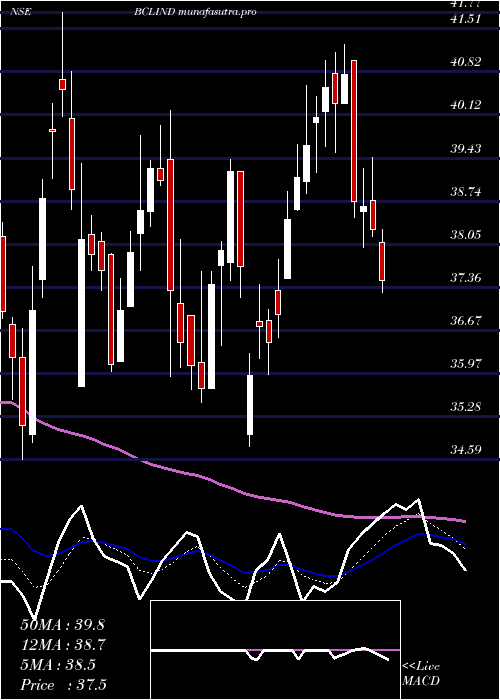
Daily price and volume Bcl Industries
| Date |
Closing |
Open |
Range |
Volume |
Thu 30 October 2025 |
40.02 (-1.36%) |
40.73 |
39.90 - 41.00 |
1.0685 times |
Wed 29 October 2025 |
40.57 (3.63%) |
39.55 |
39.19 - 40.85 |
2.0073 times |
Tue 28 October 2025 |
39.15 (-0.66%) |
39.25 |
39.05 - 39.66 |
0.5757 times |
Mon 27 October 2025 |
39.41 (-0.63%) |
39.90 |
39.24 - 40.10 |
0.6138 times |
Fri 24 October 2025 |
39.66 (-1.51%) |
40.34 |
39.54 - 40.44 |
0.852 times |
Thu 23 October 2025 |
40.27 (2.47%) |
39.84 |
39.24 - 40.75 |
1.3971 times |
Tue 21 October 2025 |
39.30 (0.77%) |
39.00 |
38.80 - 39.55 |
0.4503 times |
Mon 20 October 2025 |
39.00 (0.33%) |
39.05 |
38.43 - 39.18 |
0.7476 times |
Fri 17 October 2025 |
38.87 (-2.48%) |
40.00 |
38.63 - 40.14 |
1.7365 times |
Thu 16 October 2025 |
39.86 (0.08%) |
40.49 |
39.73 - 40.49 |
0.5511 times |
Wed 15 October 2025 |
39.83 (1.84%) |
39.10 |
38.70 - 39.98 |
1.6023 times |
Weekly price and charts BclIndustries Strong weekly Stock price targets for BclIndustries BCLIND are 39.54 and 41.49 | Weekly Target 1 | 38.07 | | Weekly Target 2 | 39.05 | | Weekly Target 3 | 40.023333333333 | | Weekly Target 4 | 41 | | Weekly Target 5 | 41.97 |
Weekly price and volumes for Bcl Industries
| Date |
Closing |
Open |
Range |
Volume |
Thu 30 October 2025 |
40.02 (0.91%) |
39.90 |
39.05 - 41.00 |
0.8896 times |
Fri 24 October 2025 |
39.66 (2.03%) |
39.05 |
38.43 - 40.75 |
0.719 times |
Fri 17 October 2025 |
38.87 (-3.86%) |
40.38 |
38.63 - 40.49 |
1.2433 times |
Fri 10 October 2025 |
40.43 (-2.39%) |
41.45 |
40.03 - 41.70 |
0.5581 times |
Fri 03 October 2025 |
41.42 (1.15%) |
40.76 |
40.30 - 42.08 |
0.6503 times |
Fri 26 September 2025 |
40.95 (0.27%) |
41.20 |
40.77 - 44.90 |
2.7293 times |
Fri 19 September 2025 |
40.84 (0.86%) |
40.51 |
39.95 - 41.70 |
0.8693 times |
Fri 12 September 2025 |
40.49 (-0.22%) |
40.78 |
40.06 - 41.15 |
0.6845 times |
Fri 05 September 2025 |
40.58 (1.48%) |
40.27 |
39.76 - 41.95 |
0.9814 times |
Fri 29 August 2025 |
39.99 (-4.44%) |
41.86 |
39.75 - 42.05 |
0.6753 times |
Fri 22 August 2025 |
41.85 (2.02%) |
41.52 |
40.80 - 42.22 |
0.8888 times |
Monthly price and charts BclIndustries Strong monthly Stock price targets for BclIndustries BCLIND are 37.4 and 41.05 | Monthly Target 1 | 36.53 | | Monthly Target 2 | 38.27 | | Monthly Target 3 | 40.176666666667 | | Monthly Target 4 | 41.92 | | Monthly Target 5 | 43.83 |
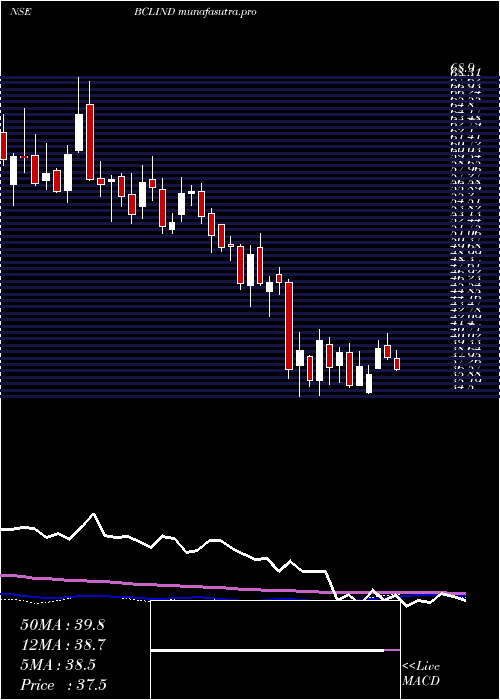
Monthly price and volumes Bcl Industries
| Date |
Closing |
Open |
Range |
Volume |
Thu 30 October 2025 |
40.02 (-1.19%) |
40.50 |
38.43 - 42.08 |
0.5341 times |
Tue 30 September 2025 |
40.50 (1.28%) |
40.27 |
39.76 - 44.90 |
0.7701 times |
Fri 29 August 2025 |
39.99 (-9.07%) |
43.98 |
39.75 - 45.35 |
0.5849 times |
Thu 31 July 2025 |
43.98 (3.53%) |
42.38 |
40.90 - 49.30 |
1.4761 times |
Mon 30 June 2025 |
42.48 (2.07%) |
42.30 |
39.92 - 44.70 |
0.9668 times |
Fri 30 May 2025 |
41.62 (11.11%) |
37.46 |
35.41 - 42.30 |
1.0379 times |
Wed 30 April 2025 |
37.46 (4.81%) |
35.74 |
34.80 - 41.25 |
0.6809 times |
Fri 28 March 2025 |
35.74 (-1.33%) |
36.22 |
34.59 - 41.77 |
1.3907 times |
Fri 28 February 2025 |
36.22 (-22.64%) |
47.60 |
34.50 - 48.40 |
1.4156 times |
Fri 31 January 2025 |
46.82 (-7.16%) |
50.60 |
43.12 - 52.01 |
1.1431 times |
Tue 31 December 2024 |
50.43 (-10.57%) |
56.39 |
49.20 - 57.46 |
1.2298 times |

DMA SMA EMA moving averages of Bcl Industries BCLIND
DMA (daily moving average) of Bcl Industries BCLIND
| DMA period | DMA value | | 5 day DMA | 39.76 | | 12 day DMA | 39.59 | | 20 day DMA | 40.07 | | 35 day DMA | 40.57 | | 50 day DMA | 40.65 | | 100 day DMA | 41.81 | | 150 day DMA | 40.86 | | 200 day DMA | 41.23 | EMA (exponential moving average) of Bcl Industries BCLIND
| EMA period | EMA current | EMA prev | EMA prev2 | | 5 day EMA | 39.89 | 39.82 | 39.44 | | 12 day EMA | 39.86 | 39.83 | 39.7 | | 20 day EMA | 40.05 | 40.05 | 39.99 | | 35 day EMA | 40.3 | 40.32 | 40.3 | | 50 day EMA | 40.63 | 40.66 | 40.66 |
SMA (simple moving average) of Bcl Industries BCLIND
| SMA period | SMA current | SMA prev | SMA prev2 | | 5 day SMA | 39.76 | 39.81 | 39.56 | | 12 day SMA | 39.59 | 39.58 | 39.57 | | 20 day SMA | 40.07 | 40.09 | 40.1 | | 35 day SMA | 40.57 | 40.57 | 40.57 | | 50 day SMA | 40.65 | 40.67 | 40.68 | | 100 day SMA | 41.81 | 41.83 | 41.85 | | 150 day SMA | 40.86 | 40.85 | 40.84 | | 200 day SMA | 41.23 | 41.27 | 41.31 |
|
|
