BrightcomGroup BCG full analysis,charts,indicators,moving averages,SMA,DMA,EMA,ADX,MACD,RSIBrightcom Group BCG WideScreen charts, DMA,SMA,EMA technical analysis, forecast prediction, by indicators ADX,MACD,RSI,CCI NSE stock exchange
Daily price and charts and targets BrightcomGroup Strong Daily Stock price targets for BrightcomGroup BCG are 13.51 and 13.96 | Daily Target 1 | 13.17 | | Daily Target 2 | 13.39 | | Daily Target 3 | 13.616666666667 | | Daily Target 4 | 13.84 | | Daily Target 5 | 14.07 |
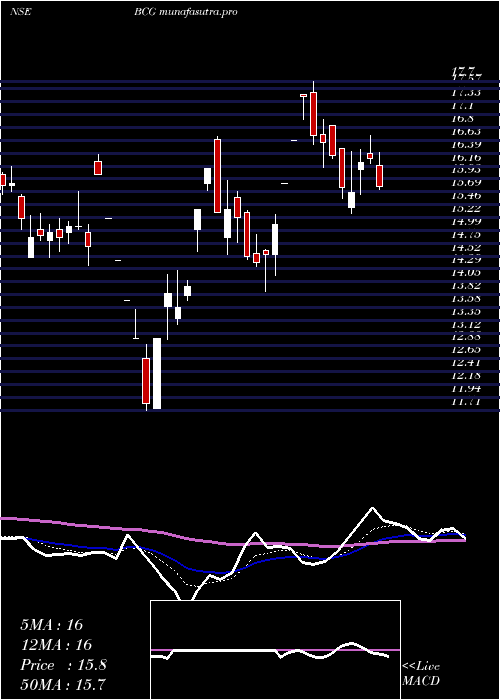
Daily price and volume Brightcom Group
| Date |
Closing |
Open |
Range |
Volume |
Tue 28 October 2025 |
13.62 (2.33%) |
13.45 |
13.39 - 13.84 |
1.7605 times |
Mon 27 October 2025 |
13.31 (-0.45%) |
13.43 |
13.23 - 13.50 |
0.8225 times |
Fri 24 October 2025 |
13.37 (-0.52%) |
13.44 |
13.14 - 13.60 |
1.1528 times |
Thu 23 October 2025 |
13.44 (-0.88%) |
13.56 |
13.40 - 13.66 |
0.914 times |
Tue 21 October 2025 |
13.56 (0.82%) |
13.55 |
13.51 - 13.74 |
0.2586 times |
Mon 20 October 2025 |
13.45 (-0.52%) |
13.61 |
13.39 - 13.82 |
0.7502 times |
Fri 17 October 2025 |
13.52 (-1.17%) |
13.72 |
13.50 - 13.77 |
0.8186 times |
Thu 16 October 2025 |
13.68 (-1.3%) |
13.92 |
13.65 - 13.98 |
0.8717 times |
Wed 15 October 2025 |
13.86 (0.58%) |
13.84 |
13.77 - 14.30 |
1.4241 times |
Tue 14 October 2025 |
13.78 (-1.71%) |
14.05 |
13.68 - 14.09 |
1.2269 times |
Mon 13 October 2025 |
14.02 (-2.84%) |
14.35 |
13.95 - 14.40 |
1.1424 times |
Weekly price and charts BrightcomGroup Strong weekly Stock price targets for BrightcomGroup BCG are 13.43 and 14.04 | Weekly Target 1 | 12.95 | | Weekly Target 2 | 13.29 | | Weekly Target 3 | 13.563333333333 | | Weekly Target 4 | 13.9 | | Weekly Target 5 | 14.17 |
Weekly price and volumes for Brightcom Group
| Date |
Closing |
Open |
Range |
Volume |
Tue 28 October 2025 |
13.62 (1.87%) |
13.43 |
13.23 - 13.84 |
0.3663 times |
Fri 24 October 2025 |
13.37 (-1.11%) |
13.61 |
13.14 - 13.82 |
0.4362 times |
Fri 17 October 2025 |
13.52 (-6.31%) |
14.35 |
13.50 - 14.40 |
0.7777 times |
Fri 10 October 2025 |
14.43 (3%) |
14.02 |
12.96 - 15.11 |
1.69 times |
Fri 03 October 2025 |
14.01 (-1.48%) |
14.49 |
13.80 - 14.49 |
0.5238 times |
Fri 26 September 2025 |
14.22 (-4.56%) |
14.90 |
14.18 - 15.10 |
1.1152 times |
Fri 19 September 2025 |
14.90 (-4.73%) |
15.71 |
14.71 - 16.15 |
1.031 times |
Fri 12 September 2025 |
15.64 (1.89%) |
15.36 |
14.51 - 16.39 |
1.4159 times |
Fri 05 September 2025 |
15.35 (-5.36%) |
16.39 |
15.06 - 16.72 |
1.1211 times |
Fri 29 August 2025 |
16.22 (-2.23%) |
16.90 |
15.30 - 16.90 |
1.523 times |
Fri 22 August 2025 |
16.59 (9.94%) |
15.84 |
15.84 - 17.70 |
2.738 times |

Monthly price and charts BrightcomGroup Strong monthly Stock price targets for BrightcomGroup BCG are 12.22 and 14.37 | Monthly Target 1 | 11.75 | | Monthly Target 2 | 12.68 | | Monthly Target 3 | 13.896666666667 | | Monthly Target 4 | 14.83 | | Monthly Target 5 | 16.05 |
Monthly price and volumes Brightcom Group
| Date |
Closing |
Open |
Range |
Volume |
Tue 28 October 2025 |
13.62 (-1.94%) |
14.03 |
12.96 - 15.11 |
0.3306 times |
Tue 30 September 2025 |
13.89 (-14.36%) |
16.39 |
13.80 - 16.72 |
0.4744 times |
Fri 29 August 2025 |
16.22 (19.44%) |
13.80 |
13.71 - 17.70 |
1.0344 times |
Thu 31 July 2025 |
13.58 (-7.62%) |
16.25 |
11.71 - 16.37 |
0.8142 times |
Thu 25 April 2024 |
14.70 (6.52%) |
13.75 |
13.70 - 17.10 |
0.9812 times |
Thu 28 March 2024 |
13.80 (-19.77%) |
17.15 |
13.55 - 19.90 |
1.2957 times |
Thu 29 February 2024 |
17.20 (-14.64%) |
20.60 |
16.35 - 20.90 |
1.3702 times |
Wed 31 January 2024 |
20.15 (4.13%) |
18.00 |
17.50 - 21.95 |
1.7002 times |
Fri 29 December 2023 |
19.35 (13.82%) |
17.30 |
16.60 - 22.95 |
1.4684 times |
Thu 30 November 2023 |
17.00 (1.49%) |
17.05 |
15.90 - 17.95 |
0.5308 times |
Tue 31 October 2023 |
16.75 (-11.38%) |
19.05 |
14.50 - 19.40 |
0.6637 times |

DMA SMA EMA moving averages of Brightcom Group BCG
DMA (daily moving average) of Brightcom Group BCG
| DMA period | DMA value | | 5 day DMA | 13.46 | | 12 day DMA | 13.67 | | 20 day DMA | 13.78 | | 35 day DMA | 14.35 | | 50 day DMA | 14.86 | | 100 day DMA | 15.04 | | 150 day DMA | 16.32 | | 200 day DMA | 16.66 | EMA (exponential moving average) of Brightcom Group BCG
| EMA period | EMA current | EMA prev | EMA prev2 | | 5 day EMA | 13.5 | 13.44 | 13.5 | | 12 day EMA | 13.65 | 13.65 | 13.71 | | 20 day EMA | 13.87 | 13.9 | 13.96 | | 35 day EMA | 14.27 | 14.31 | 14.37 | | 50 day EMA | 14.72 | 14.76 | 14.82 |
SMA (simple moving average) of Brightcom Group BCG
| SMA period | SMA current | SMA prev | SMA prev2 | | 5 day SMA | 13.46 | 13.43 | 13.47 | | 12 day SMA | 13.67 | 13.73 | 13.85 | | 20 day SMA | 13.78 | 13.81 | 13.89 | | 35 day SMA | 14.35 | 14.4 | 14.46 | | 50 day SMA | 14.86 | 14.88 | 14.9 | | 100 day SMA | 15.04 | 15.08 | 15.12 | | 150 day SMA | 16.32 | 16.36 | 16.41 | | 200 day SMA | 16.66 | 16.68 | 16.7 |
|
|
