BlackBox BBOX full analysis,charts,indicators,moving averages,SMA,DMA,EMA,ADX,MACD,RSIBlack Box BBOX WideScreen charts, DMA,SMA,EMA technical analysis, forecast prediction, by indicators ADX,MACD,RSI,CCI NSE stock exchange
Daily price and charts and targets BlackBox Strong Daily Stock price targets for BlackBox BBOX are 546.78 and 560.28 | Daily Target 1 | 544.25 | | Daily Target 2 | 549.3 | | Daily Target 3 | 557.75 | | Daily Target 4 | 562.8 | | Daily Target 5 | 571.25 |
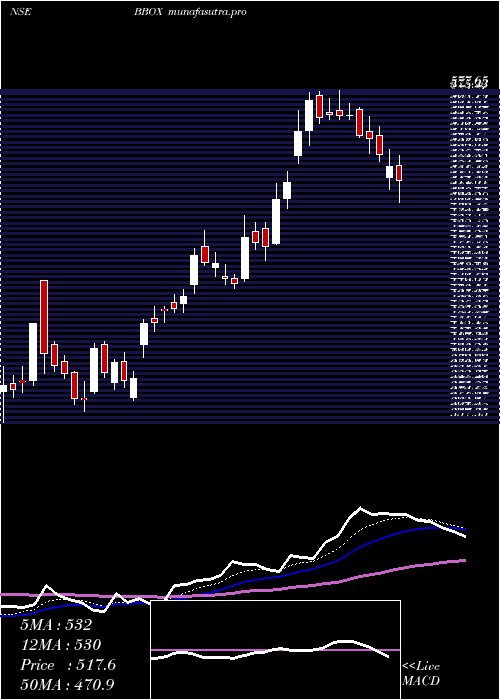
Daily price and volume Black Box
| Date |
Closing |
Open |
Range |
Volume |
Tue 28 October 2025 |
554.35 (-1.66%) |
562.00 |
552.70 - 566.20 |
0.3438 times |
Mon 27 October 2025 |
563.70 (-0.91%) |
570.00 |
560.00 - 579.95 |
0.6158 times |
Fri 24 October 2025 |
568.90 (2.15%) |
556.95 |
551.85 - 575.00 |
2.5173 times |
Thu 23 October 2025 |
556.90 (2.77%) |
543.60 |
539.90 - 559.95 |
1.2528 times |
Tue 21 October 2025 |
541.90 (1.25%) |
540.05 |
538.60 - 555.00 |
0.3219 times |
Mon 20 October 2025 |
535.20 (-0.12%) |
539.00 |
522.25 - 552.75 |
1.2806 times |
Fri 17 October 2025 |
535.85 (-3.27%) |
556.35 |
531.00 - 558.00 |
0.8486 times |
Thu 16 October 2025 |
553.95 (-2.09%) |
564.05 |
550.20 - 571.90 |
0.5691 times |
Wed 15 October 2025 |
565.75 (-0.01%) |
565.80 |
551.65 - 574.45 |
1.136 times |
Tue 14 October 2025 |
565.80 (-1.49%) |
584.00 |
559.00 - 584.00 |
1.114 times |
Mon 13 October 2025 |
574.35 (-0.18%) |
570.00 |
554.00 - 577.75 |
3.3932 times |
Weekly price and charts BlackBox Strong weekly Stock price targets for BlackBox BBOX are 539.9 and 567.15 | Weekly Target 1 | 535.08 | | Weekly Target 2 | 544.72 | | Weekly Target 3 | 562.33333333333 | | Weekly Target 4 | 571.97 | | Weekly Target 5 | 589.58 |
Weekly price and volumes for Black Box
| Date |
Closing |
Open |
Range |
Volume |
Tue 28 October 2025 |
554.35 (-2.56%) |
570.00 |
552.70 - 579.95 |
0.1563 times |
Fri 24 October 2025 |
568.90 (6.17%) |
539.00 |
522.25 - 575.00 |
0.8751 times |
Fri 17 October 2025 |
535.85 (-6.87%) |
570.00 |
531.00 - 584.00 |
1.1501 times |
Fri 10 October 2025 |
575.40 (2.96%) |
579.90 |
541.65 - 613.80 |
1.8578 times |
Fri 03 October 2025 |
558.85 (12.72%) |
505.00 |
497.30 - 558.85 |
1.2082 times |
Fri 26 September 2025 |
495.80 (1.41%) |
498.00 |
475.00 - 513.00 |
0.8836 times |
Fri 19 September 2025 |
488.90 (8.86%) |
443.05 |
443.05 - 505.10 |
1.383 times |
Fri 12 September 2025 |
449.10 (-14.82%) |
527.90 |
440.00 - 534.10 |
0.2997 times |
Fri 13 June 2025 |
527.25 (-5.94%) |
560.55 |
511.70 - 568.80 |
0.7335 times |
Fri 06 June 2025 |
560.55 (8.55%) |
534.10 |
529.00 - 577.65 |
1.4529 times |
Fri 30 May 2025 |
516.40 (14.9%) |
452.85 |
451.00 - 524.00 |
2.0376 times |

Monthly price and charts BlackBox Strong monthly Stock price targets for BlackBox BBOX are 532.03 and 636.13 | Monthly Target 1 | 455.18 | | Monthly Target 2 | 504.77 | | Monthly Target 3 | 559.28333333333 | | Monthly Target 4 | 608.87 | | Monthly Target 5 | 663.38 |
Monthly price and volumes Black Box
| Date |
Closing |
Open |
Range |
Volume |
Tue 28 October 2025 |
554.35 (7.59%) |
519.90 |
509.70 - 613.80 |
1.2235 times |
Tue 30 September 2025 |
515.25 (-0.44%) |
448.95 |
440.00 - 540.90 |
0.8456 times |
Mon 16 June 2025 |
517.55 (0.22%) |
534.10 |
503.20 - 577.65 |
0.6276 times |
Fri 30 May 2025 |
516.40 (38.39%) |
373.15 |
364.90 - 524.00 |
1.2827 times |
Wed 30 April 2025 |
373.15 (3.58%) |
361.95 |
320.85 - 451.60 |
1.0296 times |
Fri 28 March 2025 |
360.25 (-3.37%) |
373.30 |
326.35 - 389.70 |
0.977 times |
Fri 28 February 2025 |
372.80 (-27.64%) |
510.25 |
372.80 - 525.20 |
0.6288 times |
Fri 31 January 2025 |
515.20 (-20.59%) |
659.80 |
503.20 - 696.45 |
0.987 times |
Tue 31 December 2024 |
648.75 (3.15%) |
637.00 |
613.25 - 714.80 |
0.9935 times |
Fri 29 November 2024 |
628.95 (29.04%) |
500.00 |
490.00 - 632.85 |
1.4047 times |
Thu 31 October 2024 |
487.40 (20.14%) |
467.00 |
445.40 - 522.00 |
0.4029 times |

DMA SMA EMA moving averages of Black Box BBOX
DMA (daily moving average) of Black Box BBOX
| DMA period | DMA value | | 5 day DMA | 557.15 | | 12 day DMA | 557.67 | | 20 day DMA | 555.52 | | 35 day DMA | 522.59 | | 50 day DMA | 525.23 | | 100 day DMA | 454.4 | | 150 day DMA | 483.04 | | 200 day DMA | 506.31 | EMA (exponential moving average) of Black Box BBOX
| EMA period | EMA current | EMA prev | EMA prev2 | | 5 day EMA | 557.1 | 558.48 | 555.87 | | 12 day EMA | 554.04 | 553.98 | 552.21 | | 20 day EMA | 547.35 | 546.61 | 544.81 | | 35 day EMA | 537.85 | 536.88 | 535.3 | | 50 day EMA | 523.04 | 521.76 | 520.05 |
SMA (simple moving average) of Black Box BBOX
| SMA period | SMA current | SMA prev | SMA prev2 | | 5 day SMA | 557.15 | 553.32 | 547.75 | | 12 day SMA | 557.67 | 557.14 | 557.18 | | 20 day SMA | 555.52 | 552.59 | 548.52 | | 35 day SMA | 522.59 | 521.82 | 520.99 | | 50 day SMA | 525.23 | 523.13 | 520.91 | | 100 day SMA | 454.4 | 452.4 | 450.27 | | 150 day SMA | 483.04 | 483.57 | 484.26 | | 200 day SMA | 506.31 | 505.96 | 505.57 |
|
|
