BharatBijlee BBL full analysis,charts,indicators,moving averages,SMA,DMA,EMA,ADX,MACD,RSIBharat Bijlee BBL WideScreen charts, DMA,SMA,EMA technical analysis, forecast prediction, by indicators ADX,MACD,RSI,CCI NSE stock exchange
operates under Other Elect.Equip. sector
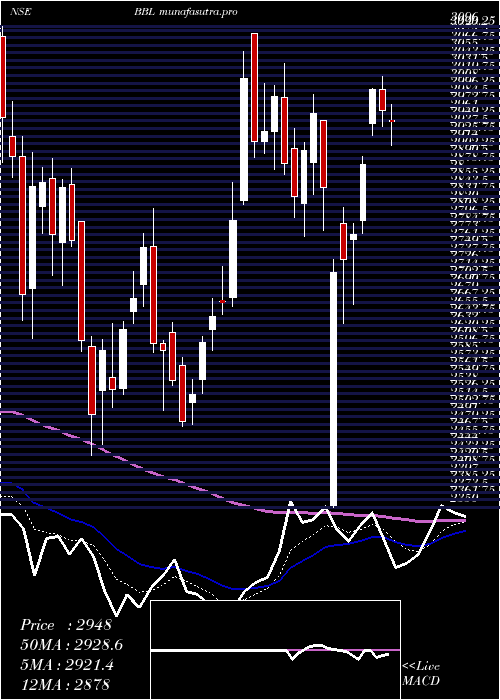
Daily price and charts and targets BharatBijlee Strong Daily Stock price targets for BharatBijlee BBL are 2989.6 and 3039.2 | Daily Target 1 | 2979.87 | | Daily Target 2 | 2999.33 | | Daily Target 3 | 3029.4666666667 | | Daily Target 4 | 3048.93 | | Daily Target 5 | 3079.07 |
Daily price and volume Bharat Bijlee
| Date |
Closing |
Open |
Range |
Volume |
Tue 28 October 2025 |
3018.80 (-0.03%) |
3021.10 |
3010.00 - 3059.60 |
0.3171 times |
Mon 27 October 2025 |
3019.70 (-0.2%) |
3040.60 |
3003.30 - 3059.00 |
0.4199 times |
Fri 24 October 2025 |
3025.70 (-2.08%) |
3101.80 |
3011.30 - 3114.60 |
0.5927 times |
Thu 23 October 2025 |
3090.10 (-0.85%) |
3125.00 |
3073.90 - 3131.00 |
1.2269 times |
Tue 21 October 2025 |
3116.70 (1.66%) |
3094.00 |
3077.20 - 3131.00 |
0.1785 times |
Mon 20 October 2025 |
3065.80 (-1.28%) |
3144.00 |
3036.70 - 3144.00 |
0.7019 times |
Fri 17 October 2025 |
3105.70 (-1.04%) |
3140.00 |
3078.10 - 3186.90 |
1.0953 times |
Thu 16 October 2025 |
3138.40 (-3.85%) |
3299.90 |
3120.00 - 3411.00 |
4.5671 times |
Wed 15 October 2025 |
3263.90 (3.51%) |
3168.00 |
3160.00 - 3275.10 |
0.4496 times |
Tue 14 October 2025 |
3153.30 (-1.16%) |
3205.00 |
3144.90 - 3239.90 |
0.4508 times |
Mon 13 October 2025 |
3190.30 (-3.32%) |
3279.00 |
3168.10 - 3315.10 |
0.5363 times |
Weekly price and charts BharatBijlee Strong weekly Stock price targets for BharatBijlee BBL are 2982.9 and 3039.2 | Weekly Target 1 | 2970.93 | | Weekly Target 2 | 2994.87 | | Weekly Target 3 | 3027.2333333333 | | Weekly Target 4 | 3051.17 | | Weekly Target 5 | 3083.53 |
Weekly price and volumes for Bharat Bijlee
| Date |
Closing |
Open |
Range |
Volume |
Tue 28 October 2025 |
3018.80 (-0.23%) |
3040.60 |
3003.30 - 3059.60 |
0.1992 times |
Fri 24 October 2025 |
3025.70 (-2.58%) |
3144.00 |
3011.30 - 3144.00 |
0.7297 times |
Fri 17 October 2025 |
3105.70 (-5.88%) |
3279.00 |
3078.10 - 3411.00 |
1.9186 times |
Fri 10 October 2025 |
3299.70 (0.01%) |
3295.90 |
3220.00 - 3358.00 |
0.6143 times |
Fri 03 October 2025 |
3299.40 (4.31%) |
3152.90 |
3120.10 - 3345.00 |
1.0297 times |
Fri 26 September 2025 |
3163.10 (1.28%) |
3123.00 |
3039.00 - 3262.00 |
1.2672 times |
Fri 19 September 2025 |
3123.00 (0.01%) |
3139.80 |
3072.10 - 3176.80 |
0.5762 times |
Fri 12 September 2025 |
3122.60 (3.5%) |
3060.00 |
2975.00 - 3150.30 |
0.8922 times |
Fri 05 September 2025 |
3017.00 (1.61%) |
3000.00 |
2955.00 - 3092.80 |
0.8736 times |
Fri 29 August 2025 |
2969.20 (6.25%) |
2813.50 |
2769.20 - 3058.80 |
1.8994 times |
Fri 22 August 2025 |
2794.60 (-0.46%) |
2832.00 |
2750.10 - 2867.90 |
0.7535 times |

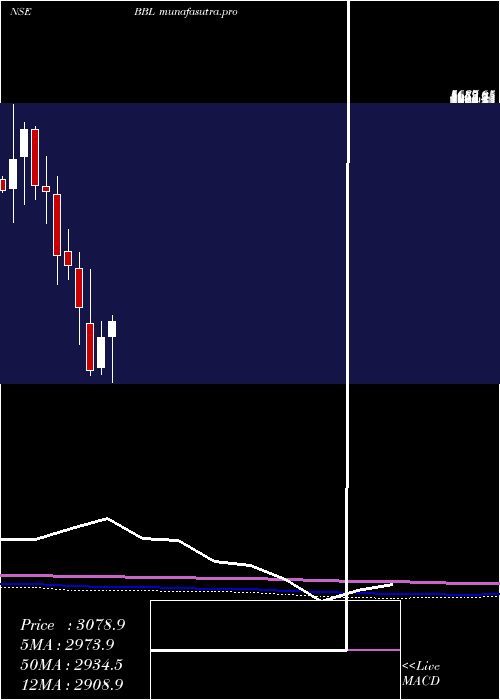
Monthly price and charts BharatBijlee Strong monthly Stock price targets for BharatBijlee BBL are 2807.2 and 3214.9 | Monthly Target 1 | 2736.67 | | Monthly Target 2 | 2877.73 | | Monthly Target 3 | 3144.3666666667 | | Monthly Target 4 | 3285.43 | | Monthly Target 5 | 3552.07 |
Monthly price and volumes Bharat Bijlee
| Date |
Closing |
Open |
Range |
Volume |
Tue 28 October 2025 |
3018.80 (-3.81%) |
3163.40 |
3003.30 - 3411.00 |
0.665 times |
Tue 30 September 2025 |
3138.30 (5.7%) |
3000.00 |
2955.00 - 3262.00 |
0.6146 times |
Fri 29 August 2025 |
2969.20 (-0.35%) |
2961.00 |
2750.10 - 3058.80 |
0.5958 times |
Thu 31 July 2025 |
2979.60 (-4%) |
3105.00 |
2830.00 - 3380.00 |
1.119 times |
Mon 30 June 2025 |
3103.70 (4.21%) |
2975.00 |
2780.60 - 3200.00 |
1.3167 times |
Fri 30 May 2025 |
2978.20 (1.93%) |
2902.50 |
2853.00 - 3475.00 |
1.7813 times |
Wed 30 April 2025 |
2921.80 (1.35%) |
2906.60 |
2350.00 - 3150.80 |
0.8241 times |
Fri 28 March 2025 |
2882.85 (15.55%) |
2532.00 |
2448.05 - 3085.00 |
1.2573 times |
Fri 28 February 2025 |
2494.80 (-23.08%) |
3054.00 |
2430.00 - 3700.00 |
1.329 times |
Fri 31 January 2025 |
3243.30 (-13.55%) |
3715.00 |
2799.00 - 3913.85 |
0.4972 times |
Tue 31 December 2024 |
3751.70 (-3.22%) |
3918.35 |
3582.60 - 4189.90 |
0.6395 times |
DMA SMA EMA moving averages of Bharat Bijlee BBL
DMA (daily moving average) of Bharat Bijlee BBL
| DMA period | DMA value | | 5 day DMA | 3054.2 | | 12 day DMA | 3124.01 | | 20 day DMA | 3176.33 | | 35 day DMA | 3143.11 | | 50 day DMA | 3073.09 | | 100 day DMA | 3042.71 | | 150 day DMA | 3023.28 | | 200 day DMA | 3012.18 | EMA (exponential moving average) of Bharat Bijlee BBL
| EMA period | EMA current | EMA prev | EMA prev2 | | 5 day EMA | 3048.84 | 3063.86 | 3085.94 | | 12 day EMA | 3102.18 | 3117.33 | 3135.08 | | 20 day EMA | 3120.96 | 3131.71 | 3143.5 | | 35 day EMA | 3094.59 | 3099.05 | 3103.72 | | 50 day EMA | 3049.46 | 3050.71 | 3051.98 |
SMA (simple moving average) of Bharat Bijlee BBL
| SMA period | SMA current | SMA prev | SMA prev2 | | 5 day SMA | 3054.2 | 3063.6 | 3080.8 | | 12 day SMA | 3124.01 | 3148.98 | 3166.77 | | 20 day SMA | 3176.33 | 3183.54 | 3190.8 | | 35 day SMA | 3143.11 | 3143.06 | 3142.44 | | 50 day SMA | 3073.09 | 3069.37 | 3064.83 | | 100 day SMA | 3042.71 | 3041.69 | 3040.41 | | 150 day SMA | 3023.28 | 3020.79 | 3018.04 | | 200 day SMA | 3012.18 | 3015.03 | 3019.01 |
|
|
