BataIndia BATAINDIA full analysis,charts,indicators,moving averages,SMA,DMA,EMA,ADX,MACD,RSIBata India BATAINDIA WideScreen charts, DMA,SMA,EMA technical analysis, forecast prediction, by indicators ADX,MACD,RSI,CCI NSE stock exchange
operates under Footwear sector
Daily price and charts and targets BataIndia Strong Daily Stock price targets for BataIndia BATAINDIA are 1052.55 and 1089.75 | Daily Target 1 | 1044.4 | | Daily Target 2 | 1060.7 | | Daily Target 3 | 1081.6 | | Daily Target 4 | 1097.9 | | Daily Target 5 | 1118.8 |
Daily price and volume Bata India
| Date |
Closing |
Open |
Range |
Volume |
Wed 29 October 2025 |
1077.00 (-2.18%) |
1101.00 |
1065.30 - 1102.50 |
2.5147 times |
Tue 28 October 2025 |
1101.00 (-5.59%) |
1110.10 |
1088.00 - 1136.30 |
4.5802 times |
Mon 27 October 2025 |
1166.20 (0.09%) |
1168.00 |
1157.30 - 1195.00 |
0.434 times |
Fri 24 October 2025 |
1165.10 (-0.21%) |
1168.00 |
1158.60 - 1174.00 |
0.1692 times |
Thu 23 October 2025 |
1167.60 (0.18%) |
1165.50 |
1161.90 - 1178.50 |
0.2779 times |
Tue 21 October 2025 |
1165.50 (0.06%) |
1170.00 |
1161.60 - 1170.80 |
0.0312 times |
Mon 20 October 2025 |
1164.80 (1.26%) |
1155.00 |
1144.30 - 1172.20 |
0.2412 times |
Fri 17 October 2025 |
1150.30 (0.23%) |
1160.00 |
1140.30 - 1161.00 |
0.4586 times |
Thu 16 October 2025 |
1147.70 (2.14%) |
1125.10 |
1125.10 - 1151.00 |
0.4505 times |
Wed 15 October 2025 |
1123.70 (-0.04%) |
1126.00 |
1108.30 - 1132.50 |
0.8426 times |
Tue 14 October 2025 |
1124.20 (-2.16%) |
1152.40 |
1117.60 - 1157.80 |
0.2512 times |
Weekly price and charts BataIndia Strong weekly Stock price targets for BataIndia BATAINDIA are 1006.3 and 1136 | Weekly Target 1 | 982.73 | | Weekly Target 2 | 1029.87 | | Weekly Target 3 | 1112.4333333333 | | Weekly Target 4 | 1159.57 | | Weekly Target 5 | 1242.13 |
Weekly price and volumes for Bata India
| Date |
Closing |
Open |
Range |
Volume |
Wed 29 October 2025 |
1077.00 (-7.56%) |
1168.00 |
1065.30 - 1195.00 |
2.1767 times |
Fri 24 October 2025 |
1165.10 (1.29%) |
1155.00 |
1144.30 - 1178.50 |
0.208 times |
Fri 17 October 2025 |
1150.30 (-1.6%) |
1170.00 |
1108.30 - 1175.50 |
0.6351 times |
Fri 10 October 2025 |
1169.00 (-3.5%) |
1201.00 |
1163.00 - 1238.00 |
0.3832 times |
Fri 03 October 2025 |
1211.40 (3.71%) |
1185.10 |
1151.00 - 1235.20 |
0.4614 times |
Fri 26 September 2025 |
1168.10 (-5.62%) |
1244.00 |
1165.10 - 1249.50 |
0.2376 times |
Fri 19 September 2025 |
1237.70 (-1.71%) |
1260.40 |
1232.50 - 1282.50 |
0.7545 times |
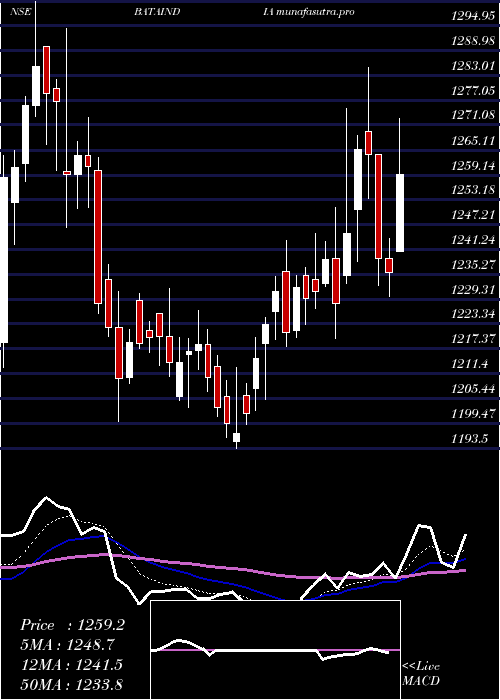
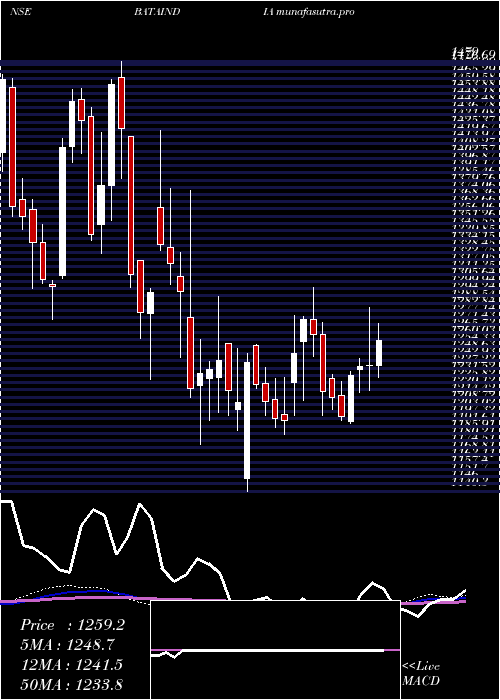
Fri 12 September 2025 |
1259.20 (1.38%) |
1236.90 |
1203.10 - 1260.00 |
0.9666 times |
Fri 05 September 2025 |
1242.10 (13.11%) |
1100.00 |
1095.90 - 1255.00 |
3.2956 times |
Fri 29 August 2025 |
1098.10 (-0.61%) |
1110.00 |
1060.00 - 1119.90 |
0.8813 times |
Fri 22 August 2025 |
1104.80 (5.25%) |
1081.00 |
1065.50 - 1150.20 |
1.3954 times |
Monthly price and charts BataIndia Strong monthly Stock price targets for BataIndia BATAINDIA are 984.8 and 1157.5 | Monthly Target 1 | 954.07 | | Monthly Target 2 | 1015.53 | | Monthly Target 3 | 1126.7666666667 | | Monthly Target 4 | 1188.23 | | Monthly Target 5 | 1299.47 |
Monthly price and volumes Bata India
| Date |
Closing |
Open |
Range |
Volume |
Wed 29 October 2025 |
1077.00 (-7.55%) |
1176.00 |
1065.30 - 1238.00 |
1.1446 times |
Tue 30 September 2025 |
1165.00 (6.09%) |
1100.00 |
1095.90 - 1282.50 |
1.6872 times |
Fri 29 August 2025 |
1098.10 (-7.82%) |
1191.20 |
1025.10 - 1198.00 |
1.2214 times |
Thu 31 July 2025 |
1191.30 (-2.45%) |
1221.90 |
1187.00 - 1284.90 |
0.7002 times |
Mon 30 June 2025 |
1221.20 (-3.37%) |
1263.80 |
1193.50 - 1272.90 |
0.4429 times |
Fri 30 May 2025 |
1263.80 (4.58%) |
1210.90 |
1185.00 - 1300.70 |
0.8749 times |
Wed 30 April 2025 |
1208.40 (-0.94%) |
1205.00 |
1140.30 - 1255.90 |
0.5929 times |
Fri 28 March 2025 |
1219.90 (-0.1%) |
1224.00 |
1177.00 - 1294.00 |
0.5726 times |
Fri 28 February 2025 |
1221.10 (-5.84%) |
1364.05 |
1213.80 - 1424.60 |
1.5787 times |
Fri 31 January 2025 |
1296.80 (-5.68%) |
1378.10 |
1228.05 - 1479.00 |
1.1845 times |
Tue 31 December 2024 |
1374.90 (-2.55%) |
1412.00 |
1327.85 - 1457.50 |
1.4195 times |
DMA SMA EMA moving averages of Bata India BATAINDIA
DMA (daily moving average) of Bata India BATAINDIA
| DMA period | DMA value | | 5 day DMA | 1135.38 | | 12 day DMA | 1141.84 | | 20 day DMA | 1162.37 | | 35 day DMA | 1190.91 | | 50 day DMA | 1175.75 | | 100 day DMA | 1192 | | 150 day DMA | 1204.13 | | 200 day DMA | 1227.07 | EMA (exponential moving average) of Bata India BATAINDIA
| EMA period | EMA current | EMA prev | EMA prev2 | | 5 day EMA | 1120.82 | 1142.72 | 1163.58 | | 12 day EMA | 1143.11 | 1155.13 | 1164.97 | | 20 day EMA | 1155.54 | 1163.8 | 1170.41 | | 35 day EMA | 1161.52 | 1166.5 | 1170.36 | | 50 day EMA | 1167.6 | 1171.3 | 1174.17 |
SMA (simple moving average) of Bata India BATAINDIA
| SMA period | SMA current | SMA prev | SMA prev2 | | 5 day SMA | 1135.38 | 1153.08 | 1165.84 | | 12 day SMA | 1141.84 | 1149.51 | 1155.45 | | 20 day SMA | 1162.37 | 1166.34 | 1169.69 | | 35 day SMA | 1190.91 | 1195.22 | 1199.25 | | 50 day SMA | 1175.75 | 1175.2 | 1175.12 | | 100 day SMA | 1192 | 1193.33 | 1194.54 | | 150 day SMA | 1204.13 | 1205.41 | 1206.53 | | 200 day SMA | 1227.07 | 1228.81 | 1230.42 |
|
|
