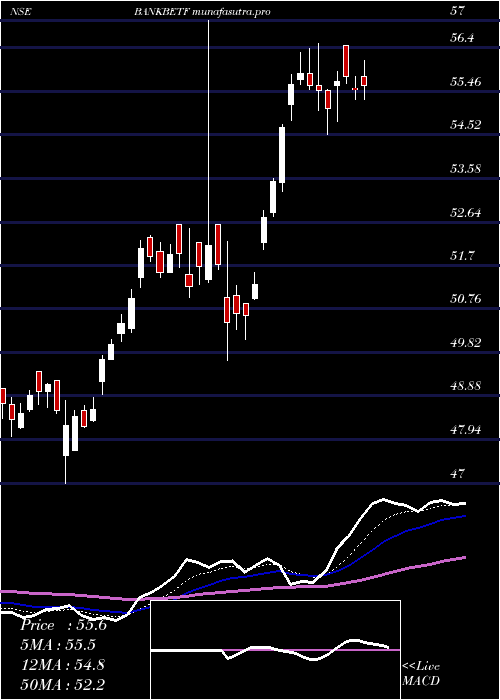
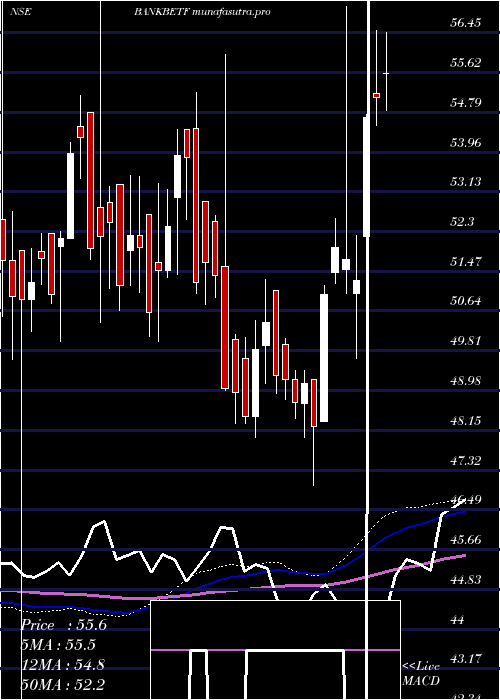
BfamBankbetf BANKBETF full analysis,charts,indicators,moving averages,SMA,DMA,EMA,ADX,MACD,RSIBfam Bankbetf BANKBETF WideScreen charts, DMA,SMA,EMA technical analysis, forecast prediction, by indicators ADX,MACD,RSI,CCI NSE stock exchange
Daily price and charts and targets BfamBankbetf Strong Daily Stock price targets for BfamBankbetf BANKBETF are 58.76 and 59.58 | Daily Target 1 | 58.09 | | Daily Target 2 | 58.6 | | Daily Target 3 | 58.91 | | Daily Target 4 | 59.42 | | Daily Target 5 | 59.73 |
Daily price and volume Bfam Bankbetf
| Date |
Closing |
Open |
Range |
Volume |
Wed 29 October 2025 |
59.11 (0.36%) |
58.90 |
58.40 - 59.22 |
0.5054 times |
Tue 28 October 2025 |
58.90 (-0.05%) |
59.22 |
58.51 - 59.22 |
0.8259 times |
Mon 27 October 2025 |
58.93 (0.91%) |
58.40 |
58.40 - 59.04 |
1.0994 times |
Fri 24 October 2025 |
58.40 (-0.58%) |
59.04 |
58.16 - 59.04 |
0.4178 times |
Thu 23 October 2025 |
58.74 (0.09%) |
58.69 |
58.66 - 59.31 |
2.1695 times |
Tue 21 October 2025 |
58.69 (-0.09%) |
58.73 |
58.56 - 59.13 |
0.3976 times |
Mon 20 October 2025 |
58.74 (0.65%) |
58.46 |
58.46 - 59.01 |
0.8379 times |
Fri 17 October 2025 |
58.36 (0.48%) |
58.18 |
57.95 - 58.50 |
1.0496 times |
Thu 16 October 2025 |
58.08 (1.06%) |
57.75 |
57.00 - 58.18 |
2.2431 times |
Wed 15 October 2025 |
57.47 (0.37%) |
57.54 |
56.98 - 57.59 |
0.4539 times |
Tue 14 October 2025 |
57.26 (-0.3%) |
57.51 |
57.01 - 57.51 |
0.7275 times |
Weekly price and charts BfamBankbetf Strong weekly Stock price targets for BfamBankbetf BANKBETF are 58.76 and 59.58 | Weekly Target 1 | 58.09 | | Weekly Target 2 | 58.6 | | Weekly Target 3 | 58.91 | | Weekly Target 4 | 59.42 | | Weekly Target 5 | 59.73 |
Weekly price and volumes for Bfam Bankbetf
| Date |
Closing |
Open |
Range |
Volume |
Wed 29 October 2025 |
59.11 (1.22%) |
58.40 |
58.40 - 59.22 |
0.3683 times |
Fri 24 October 2025 |
58.40 (0.07%) |
58.46 |
58.16 - 59.31 |
0.5792 times |
Fri 17 October 2025 |
58.36 (1.85%) |
58.73 |
56.98 - 58.73 |
0.8512 times |
Fri 10 October 2025 |
57.30 (1.83%) |
56.56 |
56.00 - 57.42 |
0.802 times |
Fri 03 October 2025 |
56.27 (2.16%) |
56.18 |
54.05 - 58.10 |
1.0998 times |
Fri 26 September 2025 |
55.08 (-2.15%) |
56.57 |
54.98 - 56.75 |
0.3354 times |
Fri 19 September 2025 |
56.29 (1.22%) |
55.61 |
55.47 - 56.50 |
0.787 times |
Fri 12 September 2025 |
55.61 (1.24%) |
55.78 |
54.76 - 56.72 |
2.104 times |
Fri 05 September 2025 |
54.93 (0.88%) |
55.40 |
54.24 - 55.90 |
1.5928 times |
Fri 29 August 2025 |
54.45 (-2.7%) |
56.24 |
54.40 - 57.73 |
1.4804 times |
Fri 22 August 2025 |
55.96 (-0.05%) |
56.01 |
55.41 - 57.08 |
0.8359 times |
Monthly price and charts BfamBankbetf Strong monthly Stock price targets for BfamBankbetf BANKBETF are 56.58 and 61.84 | Monthly Target 1 | 52.23 | | Monthly Target 2 | 55.67 | | Monthly Target 3 | 57.49 | | Monthly Target 4 | 60.93 | | Monthly Target 5 | 62.75 |
Monthly price and volumes Bfam Bankbetf
| Date |
Closing |
Open |
Range |
Volume |
Wed 29 October 2025 |
59.11 (6.62%) |
54.05 |
54.05 - 59.31 |
0.2741 times |
Tue 30 September 2025 |
55.44 (1.82%) |
55.40 |
54.24 - 58.10 |
0.4899 times |
Fri 29 August 2025 |
54.45 (-3.99%) |
55.29 |
54.40 - 62.00 |
0.3584 times |
Thu 31 July 2025 |
56.71 (-2.22%) |
57.71 |
56.07 - 58.99 |
0.2076 times |
Mon 30 June 2025 |
58.00 (3.2%) |
56.48 |
55.70 - 58.50 |
1.4204 times |
Fri 30 May 2025 |
56.20 (1.24%) |
55.78 |
53.75 - 65.00 |
0.7837 times |
Wed 30 April 2025 |
55.51 (6.83%) |
51.50 |
49.64 - 57.00 |
1.8419 times |
Fri 28 March 2025 |
51.96 (6.65%) |
48.70 |
47.00 - 52.58 |
2.2776 times |
Fri 28 February 2025 |
48.72 (-2.23%) |
49.92 |
48.40 - 51.30 |
1.0495 times |
Fri 31 January 2025 |
49.83 (-2.83%) |
51.30 |
48.01 - 56.00 |
1.297 times |
Tue 31 December 2024 |
51.28 (-2.16%) |
53.02 |
50.78 - 55.20 |
0.2431 times |
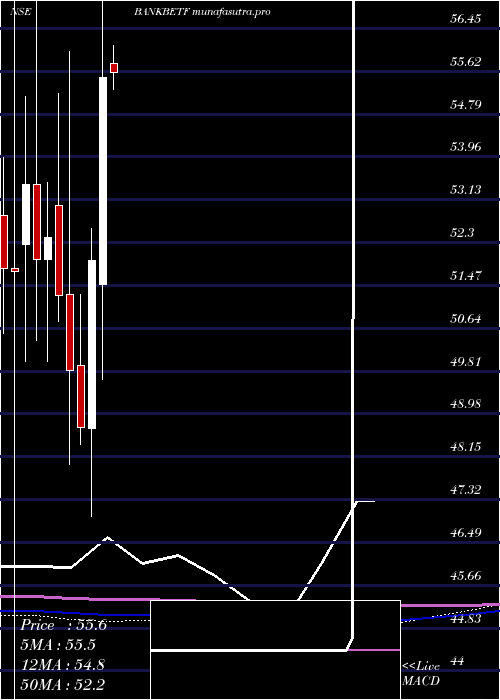
DMA SMA EMA moving averages of Bfam Bankbetf BANKBETF
DMA (daily moving average) of Bfam Bankbetf BANKBETF
| DMA period | DMA value | | 5 day DMA | 58.82 | | 12 day DMA | 58.34 | | 20 day DMA | 57.63 | | 35 day DMA | 56.82 | | 50 day DMA | 56.4 | | 100 day DMA | 56.7 | | 150 day DMA | 55.91 | | 200 day DMA | 54.26 | EMA (exponential moving average) of Bfam Bankbetf BANKBETF
| EMA period | EMA current | EMA prev | EMA prev2 | | 5 day EMA | 58.84 | 58.7 | 58.6 | | 12 day EMA | 58.33 | 58.19 | 58.06 | | 20 day EMA | 57.83 | 57.7 | 57.57 | | 35 day EMA | 57.21 | 57.1 | 56.99 | | 50 day EMA | 56.6 | 56.5 | 56.4 |
SMA (simple moving average) of Bfam Bankbetf BANKBETF
| SMA period | SMA current | SMA prev | SMA prev2 | | 5 day SMA | 58.82 | 58.73 | 58.7 | | 12 day SMA | 58.34 | 58.19 | 58.02 | | 20 day SMA | 57.63 | 57.43 | 57.24 | | 35 day SMA | 56.82 | 56.7 | 56.58 | | 50 day SMA | 56.4 | 56.34 | 56.28 | | 100 day SMA | 56.7 | 56.67 | 56.64 | | 150 day SMA | 55.91 | 55.85 | 55.79 | | 200 day SMA | 54.26 | 54.22 | 54.18 |
|
|
