BannariAmman BANARISUG full analysis,charts,indicators,moving averages,SMA,DMA,EMA,ADX,MACD,RSIBannari Amman BANARISUG WideScreen charts, DMA,SMA,EMA technical analysis, forecast prediction, by indicators ADX,MACD,RSI,CCI NSE stock exchange
operates under Sugar sector
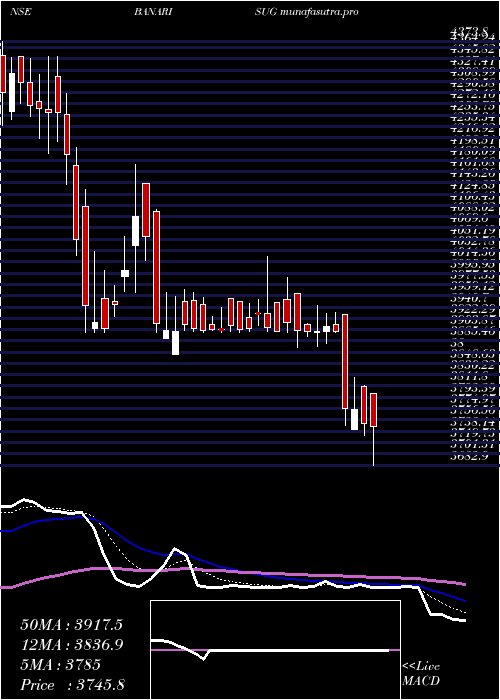
Daily price and charts and targets BannariAmman Strong Daily Stock price targets for BannariAmman BANARISUG are 3595.3 and 3613.2 | Daily Target 1 | 3591.23 | | Daily Target 2 | 3599.37 | | Daily Target 3 | 3609.1333333333 | | Daily Target 4 | 3617.27 | | Daily Target 5 | 3627.03 |
Daily price and volume Bannari Amman
| Date |
Closing |
Open |
Range |
Volume |
Wed 29 October 2025 |
3607.50 (0.1%) |
3618.70 |
3601.00 - 3618.90 |
0.3487 times |
Tue 28 October 2025 |
3604.00 (-0.03%) |
3556.10 |
3556.10 - 3614.90 |
0.5466 times |
Mon 27 October 2025 |
3605.20 (2.98%) |
3516.10 |
3516.10 - 3621.10 |
2.6741 times |
Fri 24 October 2025 |
3500.90 (0.01%) |
3514.90 |
3416.20 - 3516.40 |
0.6468 times |
Thu 23 October 2025 |
3500.60 (3.43%) |
3400.00 |
3400.00 - 3518.00 |
1.3793 times |
Tue 21 October 2025 |
3384.60 (-0.45%) |
3400.10 |
3350.00 - 3442.70 |
0.4332 times |
Mon 20 October 2025 |
3400.00 (0%) |
3400.10 |
3385.00 - 3419.50 |
0.7276 times |
Fri 17 October 2025 |
3400.00 (0%) |
3401.50 |
3400.00 - 3440.00 |
1.3853 times |
Thu 16 October 2025 |
3400.00 (-0%) |
3434.10 |
3400.00 - 3434.10 |
1.0185 times |
Wed 15 October 2025 |
3400.10 (-0.24%) |
3407.10 |
3399.00 - 3419.90 |
0.8399 times |
Tue 14 October 2025 |
3408.20 (0.14%) |
3400.00 |
3400.00 - 3425.10 |
0.8218 times |
Weekly price and charts BannariAmman Strong weekly Stock price targets for BannariAmman BANARISUG are 3561.8 and 3666.8 | Weekly Target 1 | 3476.57 | | Weekly Target 2 | 3542.03 | | Weekly Target 3 | 3581.5666666667 | | Weekly Target 4 | 3647.03 | | Weekly Target 5 | 3686.57 |
Weekly price and volumes for Bannari Amman
| Date |
Closing |
Open |
Range |
Volume |
Wed 29 October 2025 |
3607.50 (3.04%) |
3516.10 |
3516.10 - 3621.10 |
0.3572 times |
Fri 24 October 2025 |
3500.90 (2.97%) |
3400.10 |
3350.00 - 3518.00 |
0.3189 times |
Fri 17 October 2025 |
3400.00 (-2.14%) |
3497.00 |
3399.00 - 3523.00 |
0.594 times |
Fri 10 October 2025 |
3474.20 (-1.81%) |
3431.80 |
3105.20 - 3500.00 |
5.0734 times |
Fri 03 October 2025 |
3538.20 (-3.07%) |
3650.50 |
3501.00 - 3700.00 |
0.8849 times |
Fri 26 September 2025 |
3650.20 (0%) |
3696.90 |
3615.50 - 3750.00 |
0.2869 times |
Fri 19 September 2025 |
3650.20 (-2.27%) |
3676.00 |
3650.00 - 3825.80 |
0.6279 times |
Fri 12 September 2025 |
3735.10 (2.28%) |
3651.00 |
3600.10 - 3820.00 |
0.4284 times |
Fri 05 September 2025 |
3651.90 (-2.47%) |
3744.30 |
3603.50 - 3824.00 |
1.2724 times |
Fri 29 August 2025 |
3744.30 (-0.29%) |
3760.10 |
3730.00 - 3770.00 |
0.1561 times |
Fri 22 August 2025 |
3755.20 (0.13%) |
3777.00 |
3750.00 - 3799.90 |
0.2422 times |
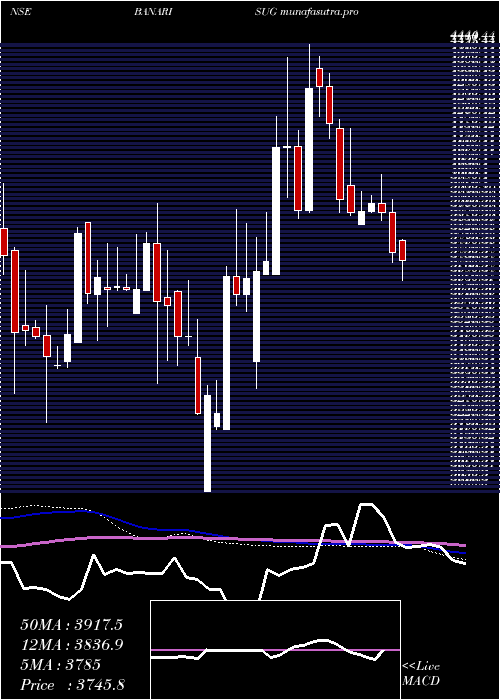
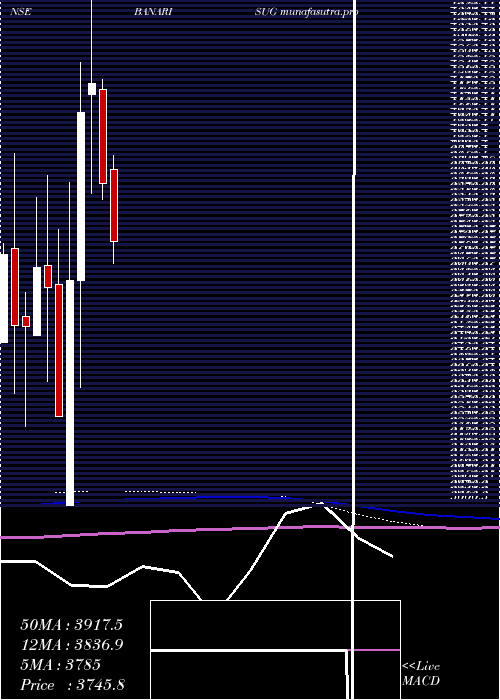
Monthly price and charts BannariAmman Strong monthly Stock price targets for BannariAmman BANARISUG are 3058.95 and 3653.75 | Monthly Target 1 | 2876.1 | | Monthly Target 2 | 3241.8 | | Monthly Target 3 | 3470.9 | | Monthly Target 4 | 3836.6 | | Monthly Target 5 | 4065.7 |
Monthly price and volumes Bannari Amman
| Date |
Closing |
Open |
Range |
Volume |
Wed 29 October 2025 |
3607.50 (-1.2%) |
3669.10 |
3105.20 - 3700.00 |
1.7254 times |
Tue 30 September 2025 |
3651.30 (-2.48%) |
3744.30 |
3600.00 - 3825.80 |
0.7512 times |
Fri 29 August 2025 |
3744.30 (-0.37%) |
3798.00 |
3665.00 - 3871.40 |
0.2783 times |
Thu 31 July 2025 |
3758.20 (-3.82%) |
3948.00 |
3682.90 - 3988.50 |
1.1031 times |
Mon 30 June 2025 |
3907.50 (-6.72%) |
4172.00 |
3863.40 - 4201.20 |
1.5144 times |
Fri 30 May 2025 |
4189.10 (1.98%) |
4159.90 |
3880.10 - 4444.00 |
1.2713 times |
Wed 30 April 2025 |
4107.70 (13.01%) |
3634.85 |
3333.00 - 4250.00 |
1.4524 times |
Fri 28 March 2025 |
3634.85 (11.76%) |
3000.30 |
3000.30 - 3912.00 |
0.4844 times |
Fri 28 February 2025 |
3252.30 (-10.01%) |
3624.85 |
3250.00 - 3780.00 |
0.5818 times |
Fri 31 January 2025 |
3613.90 (-1.54%) |
3677.55 |
3350.10 - 3929.95 |
0.8377 times |
Tue 31 December 2024 |
3670.45 (4.7%) |
3480.00 |
3480.00 - 3870.00 |
0.7571 times |
DMA SMA EMA moving averages of Bannari Amman BANARISUG
DMA (daily moving average) of Bannari Amman BANARISUG
| DMA period | DMA value | | 5 day DMA | 3563.64 | | 12 day DMA | 3467.88 | | 20 day DMA | 3458.89 | | 35 day DMA | 3553.42 | | 50 day DMA | 3601.93 | | 100 day DMA | 3720.94 | | 150 day DMA | 3808.79 | | 200 day DMA | 3741.25 | EMA (exponential moving average) of Bannari Amman BANARISUG
| EMA period | EMA current | EMA prev | EMA prev2 | | 5 day EMA | 3560.86 | 3537.54 | 3504.32 | | 12 day EMA | 3508.37 | 3490.35 | 3469.69 | | 20 day EMA | 3508.62 | 3498.22 | 3487.09 | | 35 day EMA | 3544.54 | 3540.83 | 3537.11 | | 50 day EMA | 3611.05 | 3611.19 | 3611.48 |
SMA (simple moving average) of Bannari Amman BANARISUG
| SMA period | SMA current | SMA prev | SMA prev2 | | 5 day SMA | 3563.64 | 3519.06 | 3478.26 | | 12 day SMA | 3467.88 | 3456.78 | 3428.92 | | 20 day SMA | 3458.89 | 3461.04 | 3463.35 | | 35 day SMA | 3553.42 | 3554.54 | 3555.91 | | 50 day SMA | 3601.93 | 3604.78 | 3607.71 | | 100 day SMA | 3720.94 | 3723.92 | 3727.03 | | 150 day SMA | 3808.79 | 3808.96 | 3808.27 | | 200 day SMA | 3741.25 | 3741.6 | 3741.84 |
|
|
