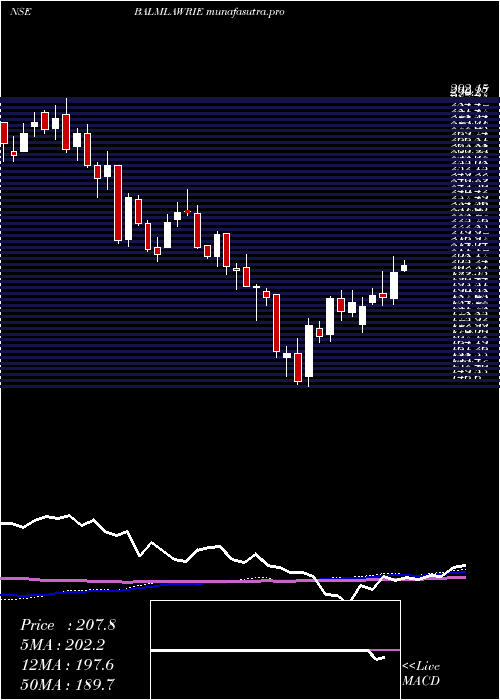
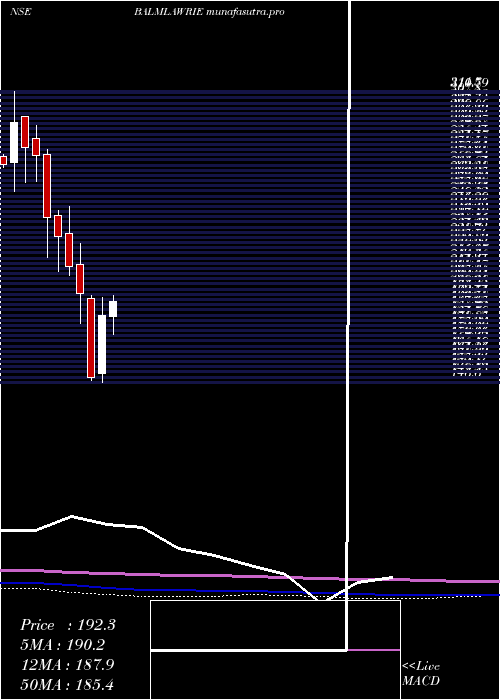
BalmerLawrie BALMLAWRIE full analysis,charts,indicators,moving averages,SMA,DMA,EMA,ADX,MACD,RSIBalmer Lawrie BALMLAWRIE WideScreen charts, DMA,SMA,EMA technical analysis, forecast prediction, by indicators ADX,MACD,RSI,CCI NSE stock exchange
operates under Diversified sector
Daily price and charts and targets BalmerLawrie Strong Daily Stock price targets for BalmerLawrie BALMLAWRIE are 199.08 and 201.02 | Daily Target 1 | 197.63 | | Daily Target 2 | 198.59 | | Daily Target 3 | 199.56666666667 | | Daily Target 4 | 200.53 | | Daily Target 5 | 201.51 |
Daily price and volume Balmer Lawrie
| Date |
Closing |
Open |
Range |
Volume |
Tue 28 October 2025 |
199.56 (0.22%) |
199.13 |
198.60 - 200.54 |
0.5506 times |
Mon 27 October 2025 |
199.13 (-0.16%) |
199.55 |
198.03 - 200.00 |
0.5939 times |
Fri 24 October 2025 |
199.45 (-0.41%) |
201.20 |
199.00 - 201.20 |
0.598 times |
Thu 23 October 2025 |
200.28 (-0.21%) |
201.30 |
199.95 - 202.90 |
1.0215 times |
Tue 21 October 2025 |
200.71 (0.65%) |
198.75 |
198.75 - 201.90 |
0.4028 times |
Mon 20 October 2025 |
199.42 (-0.55%) |
201.02 |
198.01 - 201.89 |
1.1993 times |
Fri 17 October 2025 |
200.52 (-0.71%) |
202.30 |
199.21 - 202.70 |
1.2251 times |
Thu 16 October 2025 |
201.96 (1.53%) |
199.75 |
199.63 - 203.42 |
1.0833 times |
Wed 15 October 2025 |
198.92 (-1.36%) |
204.00 |
198.00 - 204.00 |
2.3233 times |
Tue 14 October 2025 |
201.67 (0.47%) |
202.98 |
201.10 - 203.50 |
1.0021 times |
Mon 13 October 2025 |
200.72 (-2.53%) |
205.75 |
199.97 - 206.20 |
1.7549 times |

Weekly price and charts BalmerLawrie Strong weekly Stock price targets for BalmerLawrie BALMLAWRIE are 198.8 and 201.31 | Weekly Target 1 | 196.87 | | Weekly Target 2 | 198.21 | | Weekly Target 3 | 199.37666666667 | | Weekly Target 4 | 200.72 | | Weekly Target 5 | 201.89 |
Weekly price and volumes for Balmer Lawrie
| Date |
Closing |
Open |
Range |
Volume |
Tue 28 October 2025 |
199.56 (0.06%) |
199.55 |
198.03 - 200.54 |
0.1147 times |
Fri 24 October 2025 |
199.45 (-0.53%) |
201.02 |
198.01 - 202.90 |
0.323 times |
Fri 17 October 2025 |
200.52 (-2.62%) |
205.75 |
198.00 - 206.20 |
0.7407 times |
Fri 10 October 2025 |
205.92 (-2.19%) |
210.20 |
205.10 - 211.59 |
0.408 times |
Fri 03 October 2025 |
210.54 (3.31%) |
202.58 |
202.58 - 212.76 |
0.5752 times |
Fri 26 September 2025 |
203.80 (-5.76%) |
216.26 |
203.00 - 218.60 |
0.7536 times |
Fri 19 September 2025 |
216.26 (-6.58%) |
233.48 |
213.10 - 238.20 |
2.4571 times |
Fri 12 September 2025 |
231.48 (1.97%) |
228.00 |
227.50 - 234.00 |
1.4494 times |
Fri 05 September 2025 |
227.01 (4.1%) |
219.12 |
218.07 - 236.00 |
2.6131 times |
Fri 29 August 2025 |
218.07 (-2.7%) |
224.11 |
215.00 - 225.90 |
0.5651 times |
Fri 22 August 2025 |
224.11 (4.93%) |
215.00 |
214.40 - 230.75 |
1.4707 times |
Monthly price and charts BalmerLawrie Strong monthly Stock price targets for BalmerLawrie BALMLAWRIE are 191.43 and 206.13 | Monthly Target 1 | 188.72 | | Monthly Target 2 | 194.14 | | Monthly Target 3 | 203.42 | | Monthly Target 4 | 208.84 | | Monthly Target 5 | 218.12 |
Monthly price and volumes Balmer Lawrie
| Date |
Closing |
Open |
Range |
Volume |
Tue 28 October 2025 |
199.56 (-5.25%) |
210.85 |
198.00 - 212.70 |
0.3752 times |
Tue 30 September 2025 |
210.62 (-3.42%) |
219.12 |
202.58 - 238.20 |
1.5805 times |
Fri 29 August 2025 |
218.07 (3.67%) |
209.06 |
205.50 - 230.75 |
0.6298 times |
Thu 31 July 2025 |
210.36 (-1.72%) |
214.04 |
209.00 - 226.79 |
0.8154 times |
Mon 30 June 2025 |
214.04 (0.76%) |
212.00 |
201.31 - 222.90 |
0.6624 times |
Fri 30 May 2025 |
212.42 (6.19%) |
201.00 |
192.10 - 228.35 |
1.1514 times |
Wed 30 April 2025 |
200.04 (8.36%) |
184.00 |
173.68 - 212.00 |
1.3138 times |
Fri 28 March 2025 |
184.60 (23.82%) |
151.50 |
146.60 - 194.80 |
1.4781 times |
Fri 28 February 2025 |
149.09 (-24.27%) |
194.35 |
147.63 - 195.89 |
1.3911 times |
Fri 31 January 2025 |
196.87 (-7.18%) |
213.50 |
180.05 - 225.04 |
0.6023 times |
Tue 31 December 2024 |
212.09 (-7.55%) |
231.00 |
207.00 - 246.00 |
0.579 times |
DMA SMA EMA moving averages of Balmer Lawrie BALMLAWRIE
DMA (daily moving average) of Balmer Lawrie BALMLAWRIE
| DMA period | DMA value | | 5 day DMA | 199.83 | | 12 day DMA | 200.69 | | 20 day DMA | 203.85 | | 35 day DMA | 211.16 | | 50 day DMA | 214.51 | | 100 day DMA | 213.98 | | 150 day DMA | 209.41 | | 200 day DMA | 202.77 | EMA (exponential moving average) of Balmer Lawrie BALMLAWRIE
| EMA period | EMA current | EMA prev | EMA prev2 | | 5 day EMA | 199.77 | 199.87 | 200.24 | | 12 day EMA | 201.44 | 201.78 | 202.26 | | 20 day EMA | 203.96 | 204.42 | 204.98 | | 35 day EMA | 208.15 | 208.66 | 209.22 | | 50 day EMA | 212.72 | 213.26 | 213.84 |
SMA (simple moving average) of Balmer Lawrie BALMLAWRIE
| SMA period | SMA current | SMA prev | SMA prev2 | | 5 day SMA | 199.83 | 199.8 | 200.08 | | 12 day SMA | 200.69 | 201.21 | 201.83 | | 20 day SMA | 203.85 | 204.06 | 204.61 | | 35 day SMA | 211.16 | 211.95 | 212.8 | | 50 day SMA | 214.51 | 214.77 | 215.06 | | 100 day SMA | 213.98 | 214.12 | 214.23 | | 150 day SMA | 209.41 | 209.32 | 209.18 | | 200 day SMA | 202.77 | 202.82 | 202.94 |
|
|
