BalaxiVentures BALAXI full analysis,charts,indicators,moving averages,SMA,DMA,EMA,ADX,MACD,RSIBalaxi Ventures BALAXI WideScreen charts, DMA,SMA,EMA technical analysis, forecast prediction, by indicators ADX,MACD,RSI,CCI NSE stock exchange
Daily price and charts and targets BalaxiVentures Strong Daily Stock price targets for BalaxiVentures BALAXI are 40.99 and 42.16 | Daily Target 1 | 40.77 | | Daily Target 2 | 41.21 | | Daily Target 3 | 41.94 | | Daily Target 4 | 42.38 | | Daily Target 5 | 43.11 |
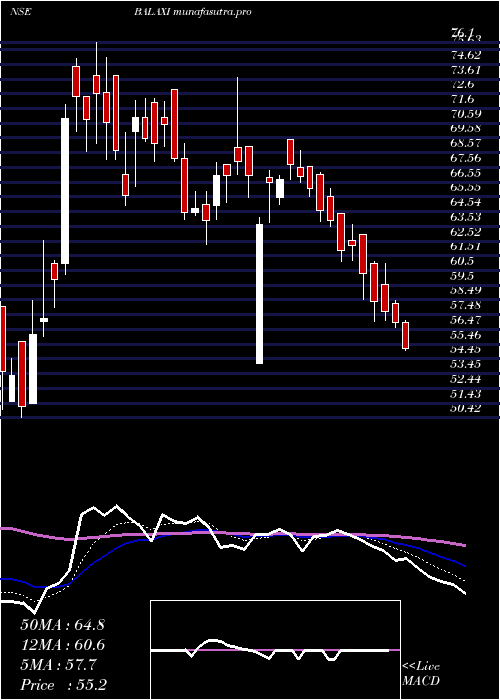
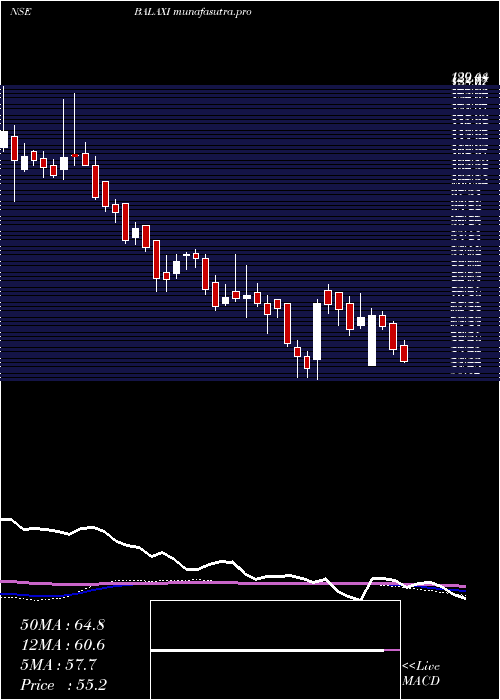
Daily price and volume Balaxi Ventures
| Date |
Closing |
Open |
Range |
Volume |
Tue 28 October 2025 |
41.65 (-1%) |
42.67 |
41.50 - 42.67 |
0.7099 times |
Mon 27 October 2025 |
42.07 (-1.96%) |
42.95 |
42.00 - 43.46 |
0.5794 times |
Fri 24 October 2025 |
42.91 (-0.85%) |
43.50 |
42.37 - 43.50 |
0.4767 times |
Thu 23 October 2025 |
43.28 (2.61%) |
42.45 |
41.95 - 43.70 |
1.503 times |
Tue 21 October 2025 |
42.18 (2.23%) |
42.39 |
41.28 - 42.94 |
0.629 times |
Mon 20 October 2025 |
41.26 (0.34%) |
41.12 |
40.92 - 42.40 |
0.8823 times |
Fri 17 October 2025 |
41.12 (-1.96%) |
42.10 |
40.76 - 42.50 |
1.359 times |
Thu 16 October 2025 |
41.94 (-0.07%) |
41.96 |
41.87 - 42.90 |
1.0688 times |
Wed 15 October 2025 |
41.97 (-1.76%) |
42.40 |
41.90 - 42.78 |
1.6431 times |
Tue 14 October 2025 |
42.72 (-2.24%) |
44.09 |
42.60 - 44.09 |
1.1488 times |
Mon 13 October 2025 |
43.70 (0.53%) |
43.00 |
43.00 - 44.36 |
1.1382 times |
Weekly price and charts BalaxiVentures Strong weekly Stock price targets for BalaxiVentures BALAXI are 40.6 and 42.56 | Weekly Target 1 | 40.24 | | Weekly Target 2 | 40.95 | | Weekly Target 3 | 42.203333333333 | | Weekly Target 4 | 42.91 | | Weekly Target 5 | 44.16 |
Weekly price and volumes for Balaxi Ventures
| Date |
Closing |
Open |
Range |
Volume |
Tue 28 October 2025 |
41.65 (-2.94%) |
42.95 |
41.50 - 43.46 |
0.1432 times |
Fri 24 October 2025 |
42.91 (4.35%) |
41.12 |
40.92 - 43.70 |
0.3876 times |
Fri 17 October 2025 |
41.12 (-5.41%) |
43.00 |
40.76 - 44.36 |
0.7059 times |
Fri 10 October 2025 |
43.47 (-3.16%) |
44.89 |
42.42 - 45.31 |
0.8978 times |
Fri 03 October 2025 |
44.89 (4.03%) |
43.30 |
42.17 - 45.34 |
0.5697 times |
Fri 26 September 2025 |
43.15 (-7.74%) |
47.71 |
42.86 - 47.71 |
1.5726 times |
Fri 19 September 2025 |
46.77 (2.79%) |
45.98 |
45.00 - 47.26 |
1.0821 times |
Fri 12 September 2025 |
45.50 (-2.88%) |
47.75 |
44.55 - 47.75 |
1.6923 times |
Fri 05 September 2025 |
46.85 (2.18%) |
46.62 |
45.51 - 47.87 |
1.5241 times |
Fri 29 August 2025 |
45.85 (-1.97%) |
47.00 |
45.18 - 47.88 |
1.4247 times |
Fri 22 August 2025 |
46.77 (-1.97%) |
48.15 |
46.50 - 49.65 |
1.946 times |
Monthly price and charts BalaxiVentures Strong monthly Stock price targets for BalaxiVentures BALAXI are 38.92 and 43.5 | Monthly Target 1 | 38 | | Monthly Target 2 | 39.83 | | Monthly Target 3 | 42.583333333333 | | Monthly Target 4 | 44.41 | | Monthly Target 5 | 47.16 |
Monthly price and volumes Balaxi Ventures
| Date |
Closing |
Open |
Range |
Volume |
Tue 28 October 2025 |
41.65 (-4.56%) |
43.99 |
40.76 - 45.34 |
0.1655 times |
Tue 30 September 2025 |
43.64 (-4.82%) |
46.62 |
42.17 - 47.87 |
0.4285 times |
Fri 29 August 2025 |
45.85 (-4.24%) |
47.40 |
42.56 - 52.00 |
0.9306 times |
Thu 31 July 2025 |
47.88 (-4.28%) |
49.71 |
46.19 - 52.50 |
1.5144 times |
Mon 30 June 2025 |
50.02 (0.06%) |
51.34 |
48.73 - 63.90 |
2.3838 times |
Fri 30 May 2025 |
49.99 (-9.37%) |
55.35 |
49.20 - 57.92 |
0.4377 times |
Wed 30 April 2025 |
55.16 (-13.7%) |
64.95 |
54.16 - 73.70 |
1.4808 times |
Fri 28 March 2025 |
63.92 (19.92%) |
55.65 |
50.42 - 76.10 |
2.1611 times |
Fri 28 February 2025 |
53.30 (-21.51%) |
72.00 |
51.00 - 72.00 |
0.0851 times |
Fri 31 January 2025 |
67.91 (-6.08%) |
72.31 |
62.78 - 84.00 |
0.4127 times |
Tue 31 December 2024 |
72.31 (-11.97%) |
83.80 |
68.91 - 85.58 |
0.1007 times |

DMA SMA EMA moving averages of Balaxi Ventures BALAXI
DMA (daily moving average) of Balaxi Ventures BALAXI
| DMA period | DMA value | | 5 day DMA | 42.42 | | 12 day DMA | 42.36 | | 20 day DMA | 42.86 | | 35 day DMA | 44 | | 50 day DMA | 44.82 | | 100 day DMA | 47.15 | | 150 day DMA | 51.12 | | 200 day DMA | 54.94 | EMA (exponential moving average) of Balaxi Ventures BALAXI
| EMA period | EMA current | EMA prev | EMA prev2 | | 5 day EMA | 42.14 | 42.39 | 42.55 | | 12 day EMA | 42.45 | 42.59 | 42.69 | | 20 day EMA | 42.93 | 43.07 | 43.17 | | 35 day EMA | 43.77 | 43.9 | 44.01 | | 50 day EMA | 44.77 | 44.9 | 45.02 |
SMA (simple moving average) of Balaxi Ventures BALAXI
| SMA period | SMA current | SMA prev | SMA prev2 | | 5 day SMA | 42.42 | 42.34 | 42.15 | | 12 day SMA | 42.36 | 42.45 | 42.5 | | 20 day SMA | 42.86 | 42.93 | 43.02 | | 35 day SMA | 44 | 44.15 | 44.28 | | 50 day SMA | 44.82 | 44.96 | 45.09 | | 100 day SMA | 47.15 | 47.24 | 47.34 | | 150 day SMA | 51.12 | 51.31 | 51.47 | | 200 day SMA | 54.94 | 55.12 | 55.28 |
|
|
