IndefManufacturing BAJAJINDEF full analysis,charts,indicators,moving averages,SMA,DMA,EMA,ADX,MACD,RSIIndef Manufacturing BAJAJINDEF WideScreen charts, DMA,SMA,EMA technical analysis, forecast prediction, by indicators ADX,MACD,RSI,CCI NSE stock exchange
Daily price and charts and targets IndefManufacturing Strong Daily Stock price targets for IndefManufacturing BAJAJINDEF are 377.35 and 387.65 | Daily Target 1 | 375.35 | | Daily Target 2 | 379.35 | | Daily Target 3 | 385.65 | | Daily Target 4 | 389.65 | | Daily Target 5 | 395.95 |
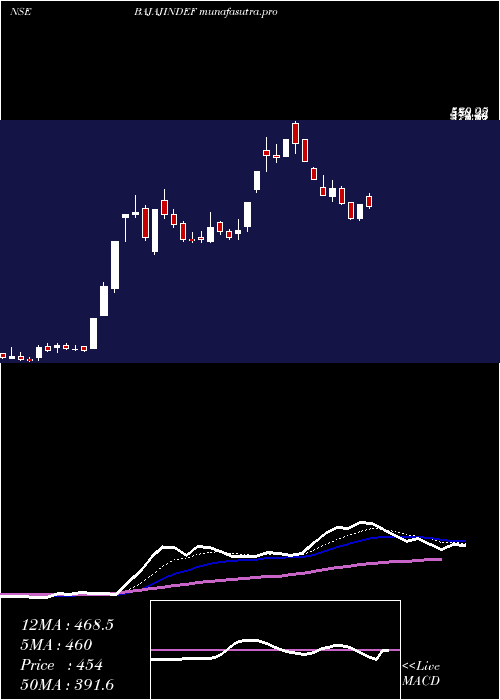
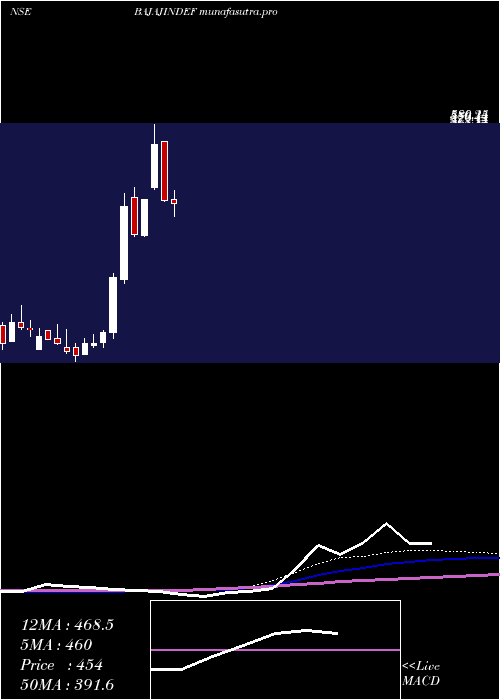
Daily price and volume Indef Manufacturing
| Date |
Closing |
Open |
Range |
Volume |
Tue 28 October 2025 |
383.35 (-1.36%) |
390.35 |
381.65 - 391.95 |
0.3043 times |
Mon 27 October 2025 |
388.65 (0.34%) |
397.90 |
383.15 - 397.90 |
0.6809 times |
Fri 24 October 2025 |
387.35 (-3.34%) |
398.00 |
384.30 - 400.85 |
0.8516 times |
Thu 23 October 2025 |
400.75 (-1%) |
411.90 |
398.00 - 418.45 |
0.4733 times |
Tue 21 October 2025 |
404.80 (-0.99%) |
421.00 |
396.00 - 421.00 |
0.2098 times |
Mon 20 October 2025 |
408.85 (0.26%) |
406.00 |
395.00 - 414.00 |
0.5607 times |
Fri 17 October 2025 |
407.80 (-0.31%) |
412.00 |
400.05 - 430.00 |
0.621 times |
Thu 16 October 2025 |
409.05 (0.52%) |
414.90 |
407.10 - 424.75 |
1.301 times |
Wed 15 October 2025 |
406.95 (2.04%) |
380.10 |
380.10 - 427.50 |
2.8545 times |
Tue 14 October 2025 |
398.80 (-4.25%) |
407.10 |
389.00 - 432.70 |
2.1429 times |
Mon 13 October 2025 |
416.50 (-2.06%) |
425.25 |
412.50 - 425.25 |
0.6406 times |
Weekly price and charts IndefManufacturing Strong weekly Stock price targets for IndefManufacturing BAJAJINDEF are 374.38 and 390.63 | Weekly Target 1 | 371.38 | | Weekly Target 2 | 377.37 | | Weekly Target 3 | 387.63333333333 | | Weekly Target 4 | 393.62 | | Weekly Target 5 | 403.88 |
Weekly price and volumes for Indef Manufacturing
| Date |
Closing |
Open |
Range |
Volume |
Tue 28 October 2025 |
383.35 (-1.03%) |
397.90 |
381.65 - 397.90 |
0.1802 times |
Fri 24 October 2025 |
387.35 (-5.01%) |
406.00 |
384.30 - 421.00 |
0.3833 times |
Fri 17 October 2025 |
407.80 (-4.1%) |
425.25 |
380.10 - 432.70 |
1.3831 times |
Fri 10 October 2025 |
425.25 (16.51%) |
370.00 |
366.25 - 442.60 |
3.5587 times |
Fri 03 October 2025 |
365.00 (0.16%) |
364.60 |
344.65 - 374.40 |
0.4917 times |
Fri 26 September 2025 |
364.40 (-10.35%) |
406.45 |
363.00 - 414.00 |
0.526 times |
Fri 19 September 2025 |
406.45 (11.91%) |
367.95 |
360.00 - 420.90 |
1.4386 times |
Fri 12 September 2025 |
363.20 (1.18%) |
360.60 |
333.00 - 364.80 |
0.8878 times |
Fri 05 September 2025 |
358.95 (-0.75%) |
363.60 |
355.05 - 369.75 |
0.4814 times |
Fri 29 August 2025 |
361.65 (-5.78%) |
385.15 |
352.05 - 389.80 |
0.6691 times |
Fri 22 August 2025 |
383.85 (4.19%) |
371.95 |
350.00 - 383.85 |
1.2037 times |
Monthly price and charts IndefManufacturing Strong monthly Stock price targets for IndefManufacturing BAJAJINDEF are 364 and 461.95 | Monthly Target 1 | 292.25 | | Monthly Target 2 | 337.8 | | Monthly Target 3 | 390.2 | | Monthly Target 4 | 435.75 | | Monthly Target 5 | 488.15 |
Monthly price and volumes Indef Manufacturing
| Date |
Closing |
Open |
Range |
Volume |
Tue 28 October 2025 |
383.35 (5.68%) |
352.00 |
344.65 - 442.60 |
0.4022 times |
Tue 30 September 2025 |
362.75 (0.3%) |
363.60 |
333.00 - 420.90 |
0.2543 times |
Fri 29 August 2025 |
361.65 (-15.51%) |
436.00 |
350.00 - 449.90 |
0.3589 times |
Thu 31 July 2025 |
428.05 (-15.43%) |
537.00 |
393.20 - 580.25 |
1.7175 times |
Mon 30 June 2025 |
506.12 (105.22%) |
246.62 |
238.00 - 506.12 |
4.2681 times |
Fri 30 May 2025 |
246.62 (9.12%) |
226.00 |
200.05 - 250.19 |
0.3419 times |
Wed 30 April 2025 |
226.00 (-11.56%) |
252.60 |
220.00 - 265.40 |
0.2627 times |
Fri 28 March 2025 |
255.53 (0%) |
258.00 |
220.50 - 289.95 |
0.3945 times |
Tue 28 October 2025 |
(0%) |
|
- |
0 times |

DMA SMA EMA moving averages of Indef Manufacturing BAJAJINDEF
DMA (daily moving average) of Indef Manufacturing BAJAJINDEF
| DMA period | DMA value | | 5 day DMA | 392.98 | | 12 day DMA | 403.18 | | 20 day DMA | 395.21 | | 35 day DMA | 385.42 | | 50 day DMA | 378.67 | | 100 day DMA | 407.49 | | 150 day DMA | 350.9 | | 200 day DMA | | EMA (exponential moving average) of Indef Manufacturing BAJAJINDEF
| EMA period | EMA current | EMA prev | EMA prev2 | | 5 day EMA | 391.52 | 395.6 | 399.07 | | 12 day EMA | 396.19 | 398.52 | 400.31 | | 20 day EMA | 394.58 | 395.76 | 396.51 | | 35 day EMA | 389.15 | 389.49 | 389.54 | | 50 day EMA | 381.71 | 381.64 | 381.35 |
SMA (simple moving average) of Indef Manufacturing BAJAJINDEF
| SMA period | SMA current | SMA prev | SMA prev2 | | 5 day SMA | 392.98 | 398.08 | 401.91 | | 12 day SMA | 403.18 | 405.48 | 408.38 | | 20 day SMA | 395.21 | 394.26 | 393.66 | | 35 day SMA | 385.42 | 384.72 | 383.88 | | 50 day SMA | 378.67 | 378.43 | 378.47 | | 100 day SMA | 407.49 | 406.04 | 404.57 | | 150 day SMA | 350.9 | 350.03 | 349.09 | | 200 day SMA |
|
|
